
[Paper Review] A comprehensive guide for measuring total vanadium concentration and state of charge of vanadium electrolytes using UV-Visible spectroscopy
This paper presents a validated UV-Vis spectroscopy method for accurately measuring total vanadium concentration and state of charge in vanadium electrolytes using spectrophotometric titration and spectral deconvolution. The key contribution is a robust empirical fitting model with optimal power-law exponent k=2.09, achieving high R² values and low error (E_X ≈ 1%) in deconvolution.
This paper presents an exhaustive how-to guide on measuring the total vanadium concentration and state of charge of vanadium electrolytes using UV-Visible spectroscopy. The study is provided with an open-access database (https://github.com/AngeAM/SOC_Vanadium_Spectra_2023.git) that supports the methods and procedures and facilitates access to the calibration data. The study covers the three types of electrolyte solutions relevant to vanadium redox flow batteries, namely the anolyte $V^{II}/V^{III}$, the catholyte $V^{IV}V^V$, and the $V^{III}/V^{IV}$ commercial electrolyte, meant to be preconditioned to either $V^{III}$ or $V^{IV}$ before battery operation. Analytical expressions to calculate the concentration of different vanadium species in the electrolyte solutions are provided based on either empirical correlations or spectral deconvolution methods. The paper also examines the limitations of the measurement technique and provides insightful recommendations for future research. The open-access database provided by the authors is expected to serve as a valuable repository for scholars and scientists working in the field of vanadium redox flow batteries.
Motivation & Objective
- To develop a reliable method for quantifying total vanadium concentration and state of charge in vanadium electrolytes using UV-Vis spectroscopy.
- To address the challenge of accurate speciation in complex vanadium mixtures by establishing reference endpoints via spectrophotometric titration.
- To optimize the spectral deconvolution model by determining the best-fit power-law exponent k for minimizing experimental error.
- To improve the accuracy of molar absorptivity estimation for the V(IV)/V(V) complex through empirical averaging and error analysis.
Proposed method
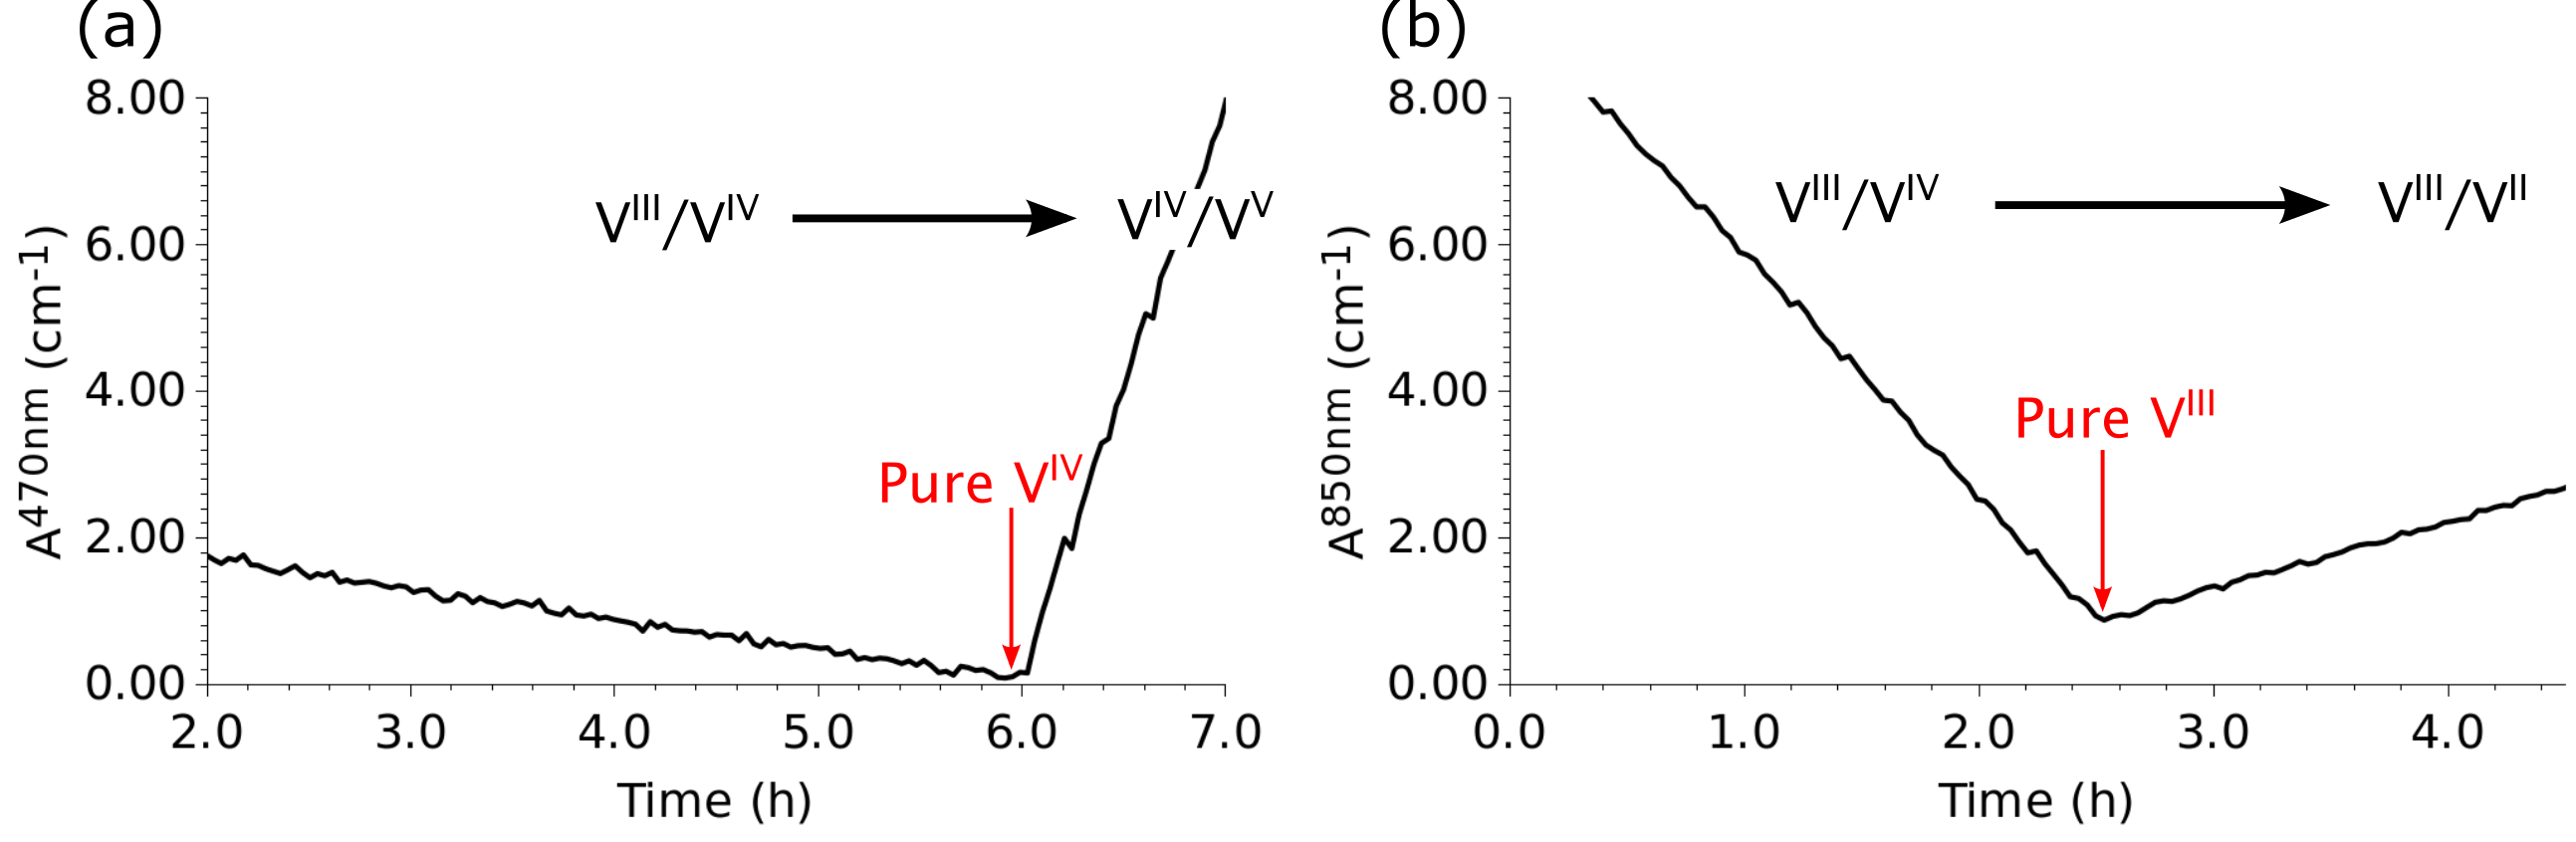
- Employing spectrophotometric titration to monitor absorbance changes during redox transitions, identifying inflection points as pure-state endpoints for V(III)/V(IV) and V(IV)/V(V) systems.
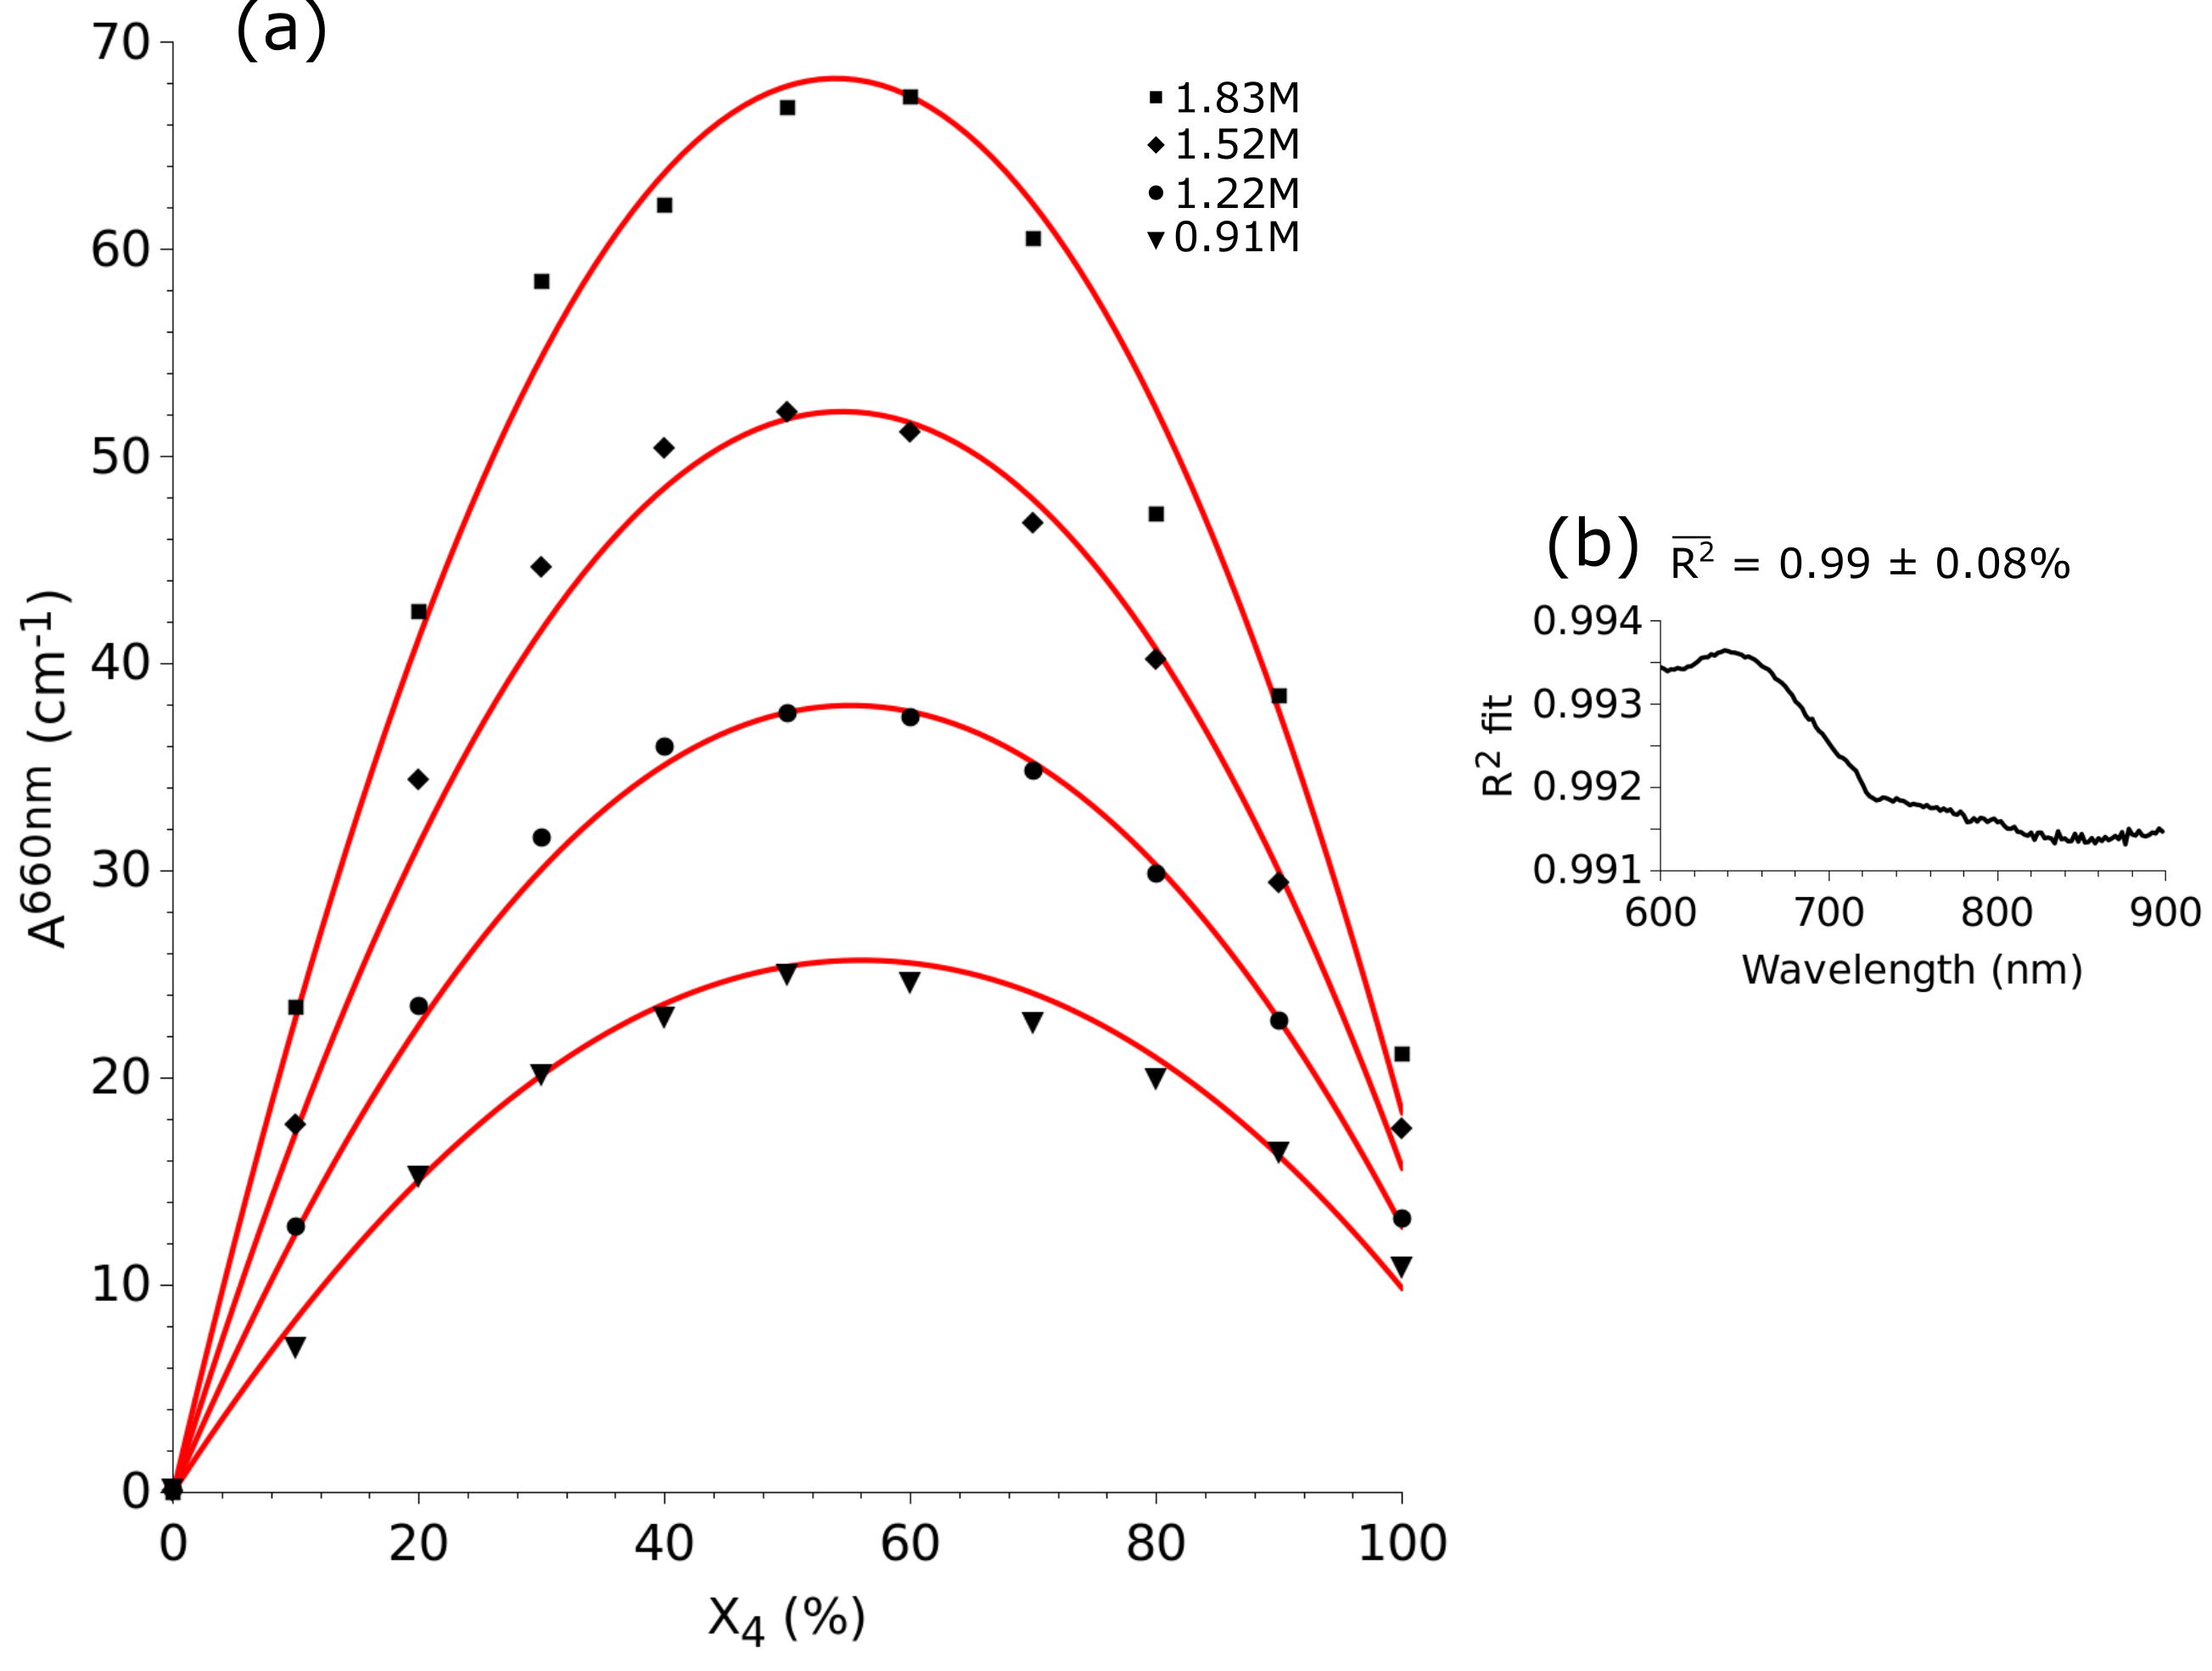
- Using empirical fitting of absorbance data at 660 nm across four concentrations to model the V(IV)/V(V) mixture, with R² calculated as a measure of fit quality.
- Applying Equation (27) to compute molar absorptivity ε₄₅ for the complex across 36 calibration samples, excluding X₄ = 0% and 100% to isolate the complex's contribution.
- Averaging computed ε₄₅ values to generate a reference curve for calibration, with dispersion analysis indicating model limitations (3–12% variation).
- Conducting a parametric study to optimize the power-law exponent k in Equations (2), (27), and (28), minimizing the product of root mean square errors (E_X₄ and E_C).
- Selecting k = 2.09 as the optimal value based on a clear minimum in error product, consistent with results from single-wavelength analysis at 440 nm.
Experimental results
Research questions
- RQ1What is the optimal value of the power-law exponent k that minimizes spectral deconvolution error in vanadium electrolyte analysis?
- RQ2How accurately can total vanadium concentration and oxidation state be determined using empirical fitting of UV-Vis absorbance data?
- RQ3To what extent does the molar absorptivity of the V(IV)/V(V) complex vary across different concentrations and compositions, and can a representative value be reliably derived?
- RQ4Can spectrophotometric titration reliably identify pure oxidation state endpoints for calibration purposes in vanadium electrolytes?
- RQ5What is the impact of non-linear effects on the accuracy of the absorbance model, and how can it be improved?
Key findings
- The empirical fitting of absorbance at 660 nm achieved a high coefficient of determination (R²), confirming strong agreement between experimental and predicted values.
- The optimal power-law exponent for spectral deconvolution was determined to be k = 2.09, minimizing the combined error in oxidation state (E_X₄) and total concentration (E_C).
- The average molar absorptivity ε₄₅ of the complex yielded a root mean square error of approximately 1% in deconvolution, indicating high accuracy.
- Despite high R² values, a dispersion of 3–12% in individual ε₄₅ values suggests non-linear effects may limit current model accuracy.
- The value k = 2.09 is consistent with the previously reported k = 1.88 from single-wavelength analysis at 440 nm, supporting its reliability.
- Spectrophotometric titration successfully identified distinct inflection points at 470 nm (oxidation) and 850 nm (reduction), enabling precise endpoint detection for reference electrolyte preparation.
Better researchstarts right now
From reading papers to final review, dramatically reduce your research time.
No credit card · Free plan available
This review was created by AI and reviewed by human editors.