[Paper Review] A Cross-Domain Approach to Analyzing the Short-Run Impact of COVID-19 on the U.S. Electricity Sector
The paper introduces COVID-EMDA +, a cross-domain data hub integrating electricity market data with COVID-19 health, mobility, and satellite data, and uses a Restricted VAR model to quantify COVID-19’s short-run impact on U.S. electricity consumption across markets.
The novel coronavirus disease (COVID-19) has rapidly spread around the globe in 2020, with the U.S. becoming the epicenter of COVID-19 cases since late March. As the U.S. begins to gradually resume economic activity, it is imperative for policymakers and power system operators to take a scientific approach to understanding and predicting the impact on the electricity sector. Here, we release a first-of-its-kind cross-domain open-access data hub, integrating data from across all existing U.S. wholesale electricity markets with COVID-19 case, weather, cellular location, and satellite imaging data. Leveraging cross-domain insights from public health and mobility data, we uncover a significant reduction in electricity consumption across that is strongly correlated with the rise in the number of COVID-19 cases, degree of social distancing, and level of commercial activity.
Motivation & Objective
- Motivate the need for cross-domain analysis to assess COVID-19 effects on electricity demand.
- Create an open-access data hub (COVID-EMDA +) integrating electricity markets with health, mobility, weather, and satellite data.
- Develop a statistical framework to quantify changes in electricity consumption relative to cross-domain indicators.
- Quantify region-specific and city-specific reductions and identify key drivers of load changes.
Proposed method
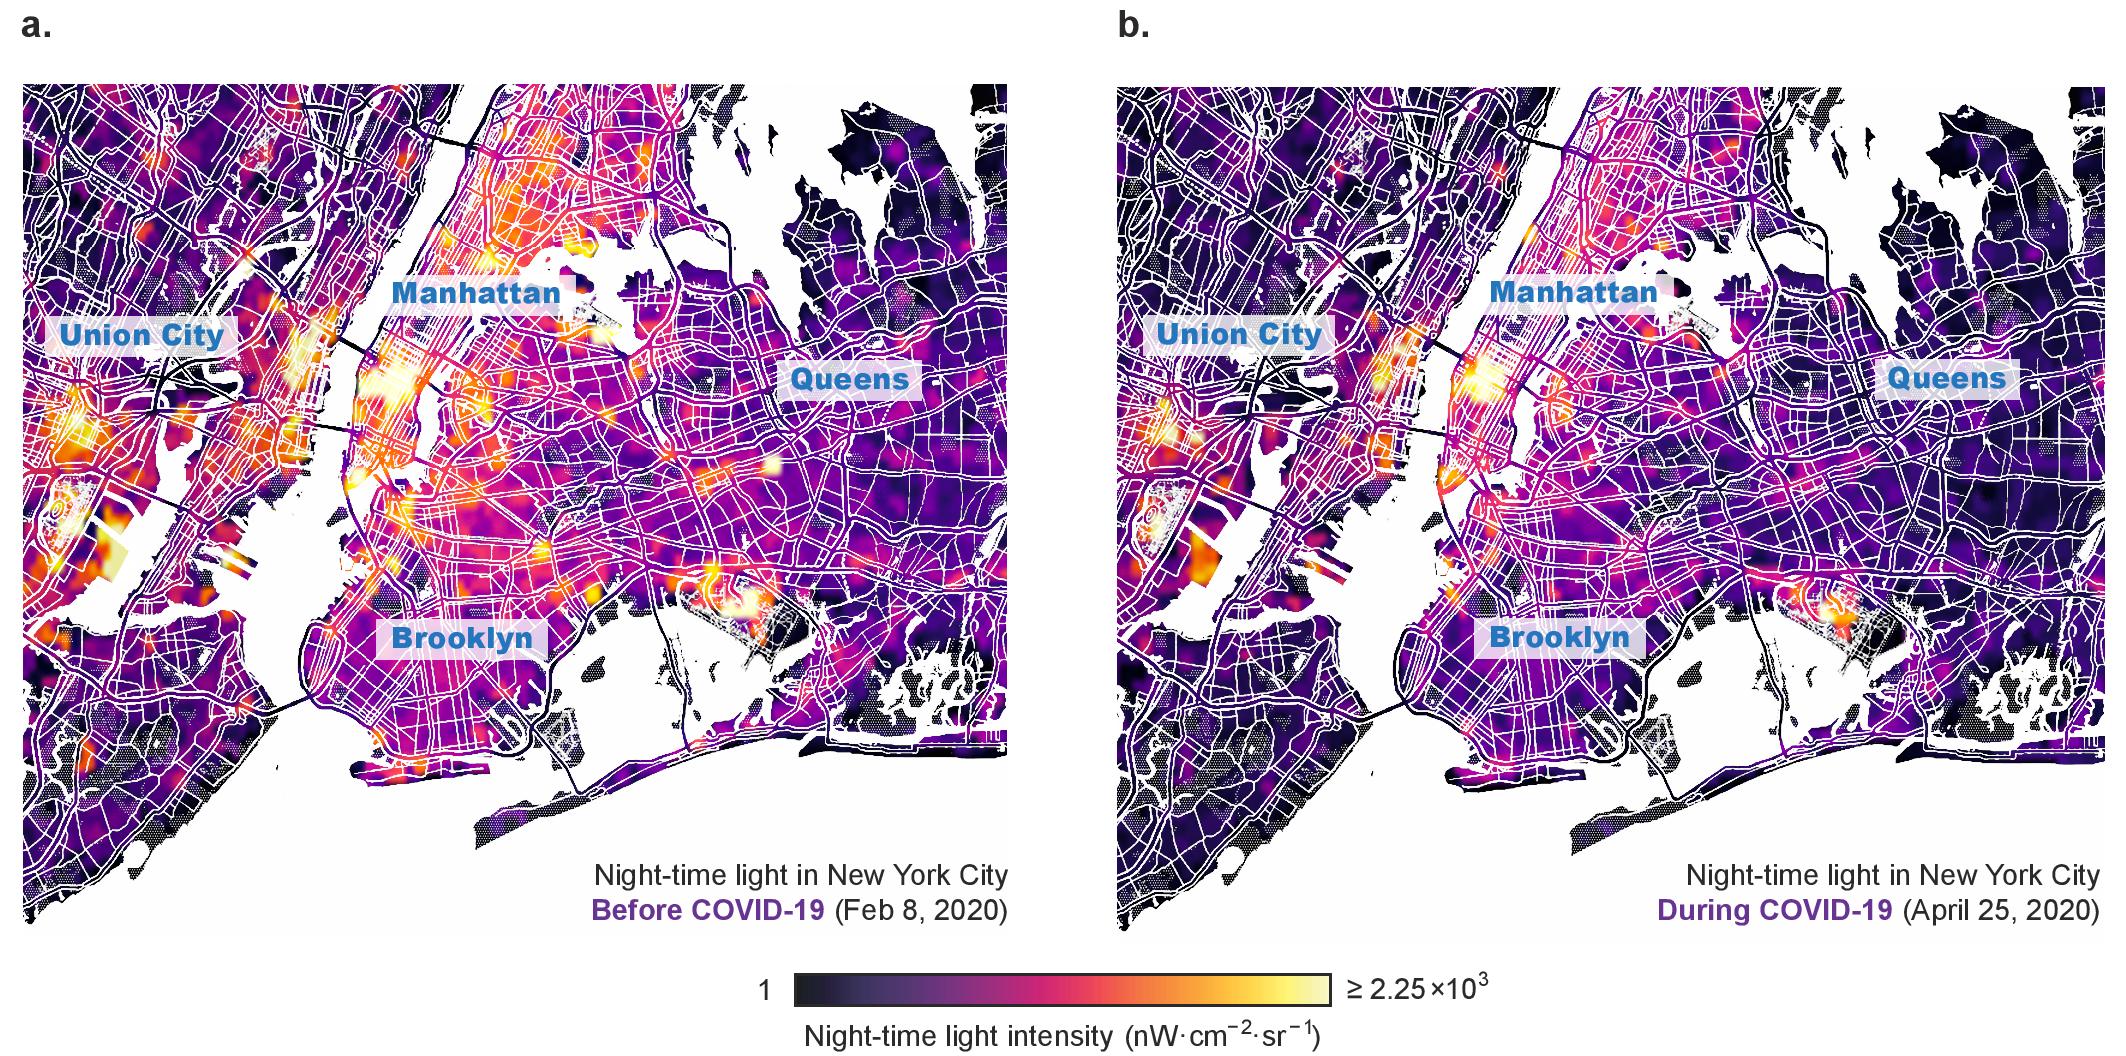
- Construct an open-access data hub COVID-EMDA + aggregating electricity market, weather, COVID-19 case data, mobility (SafeGraph), and satellite imagery data.
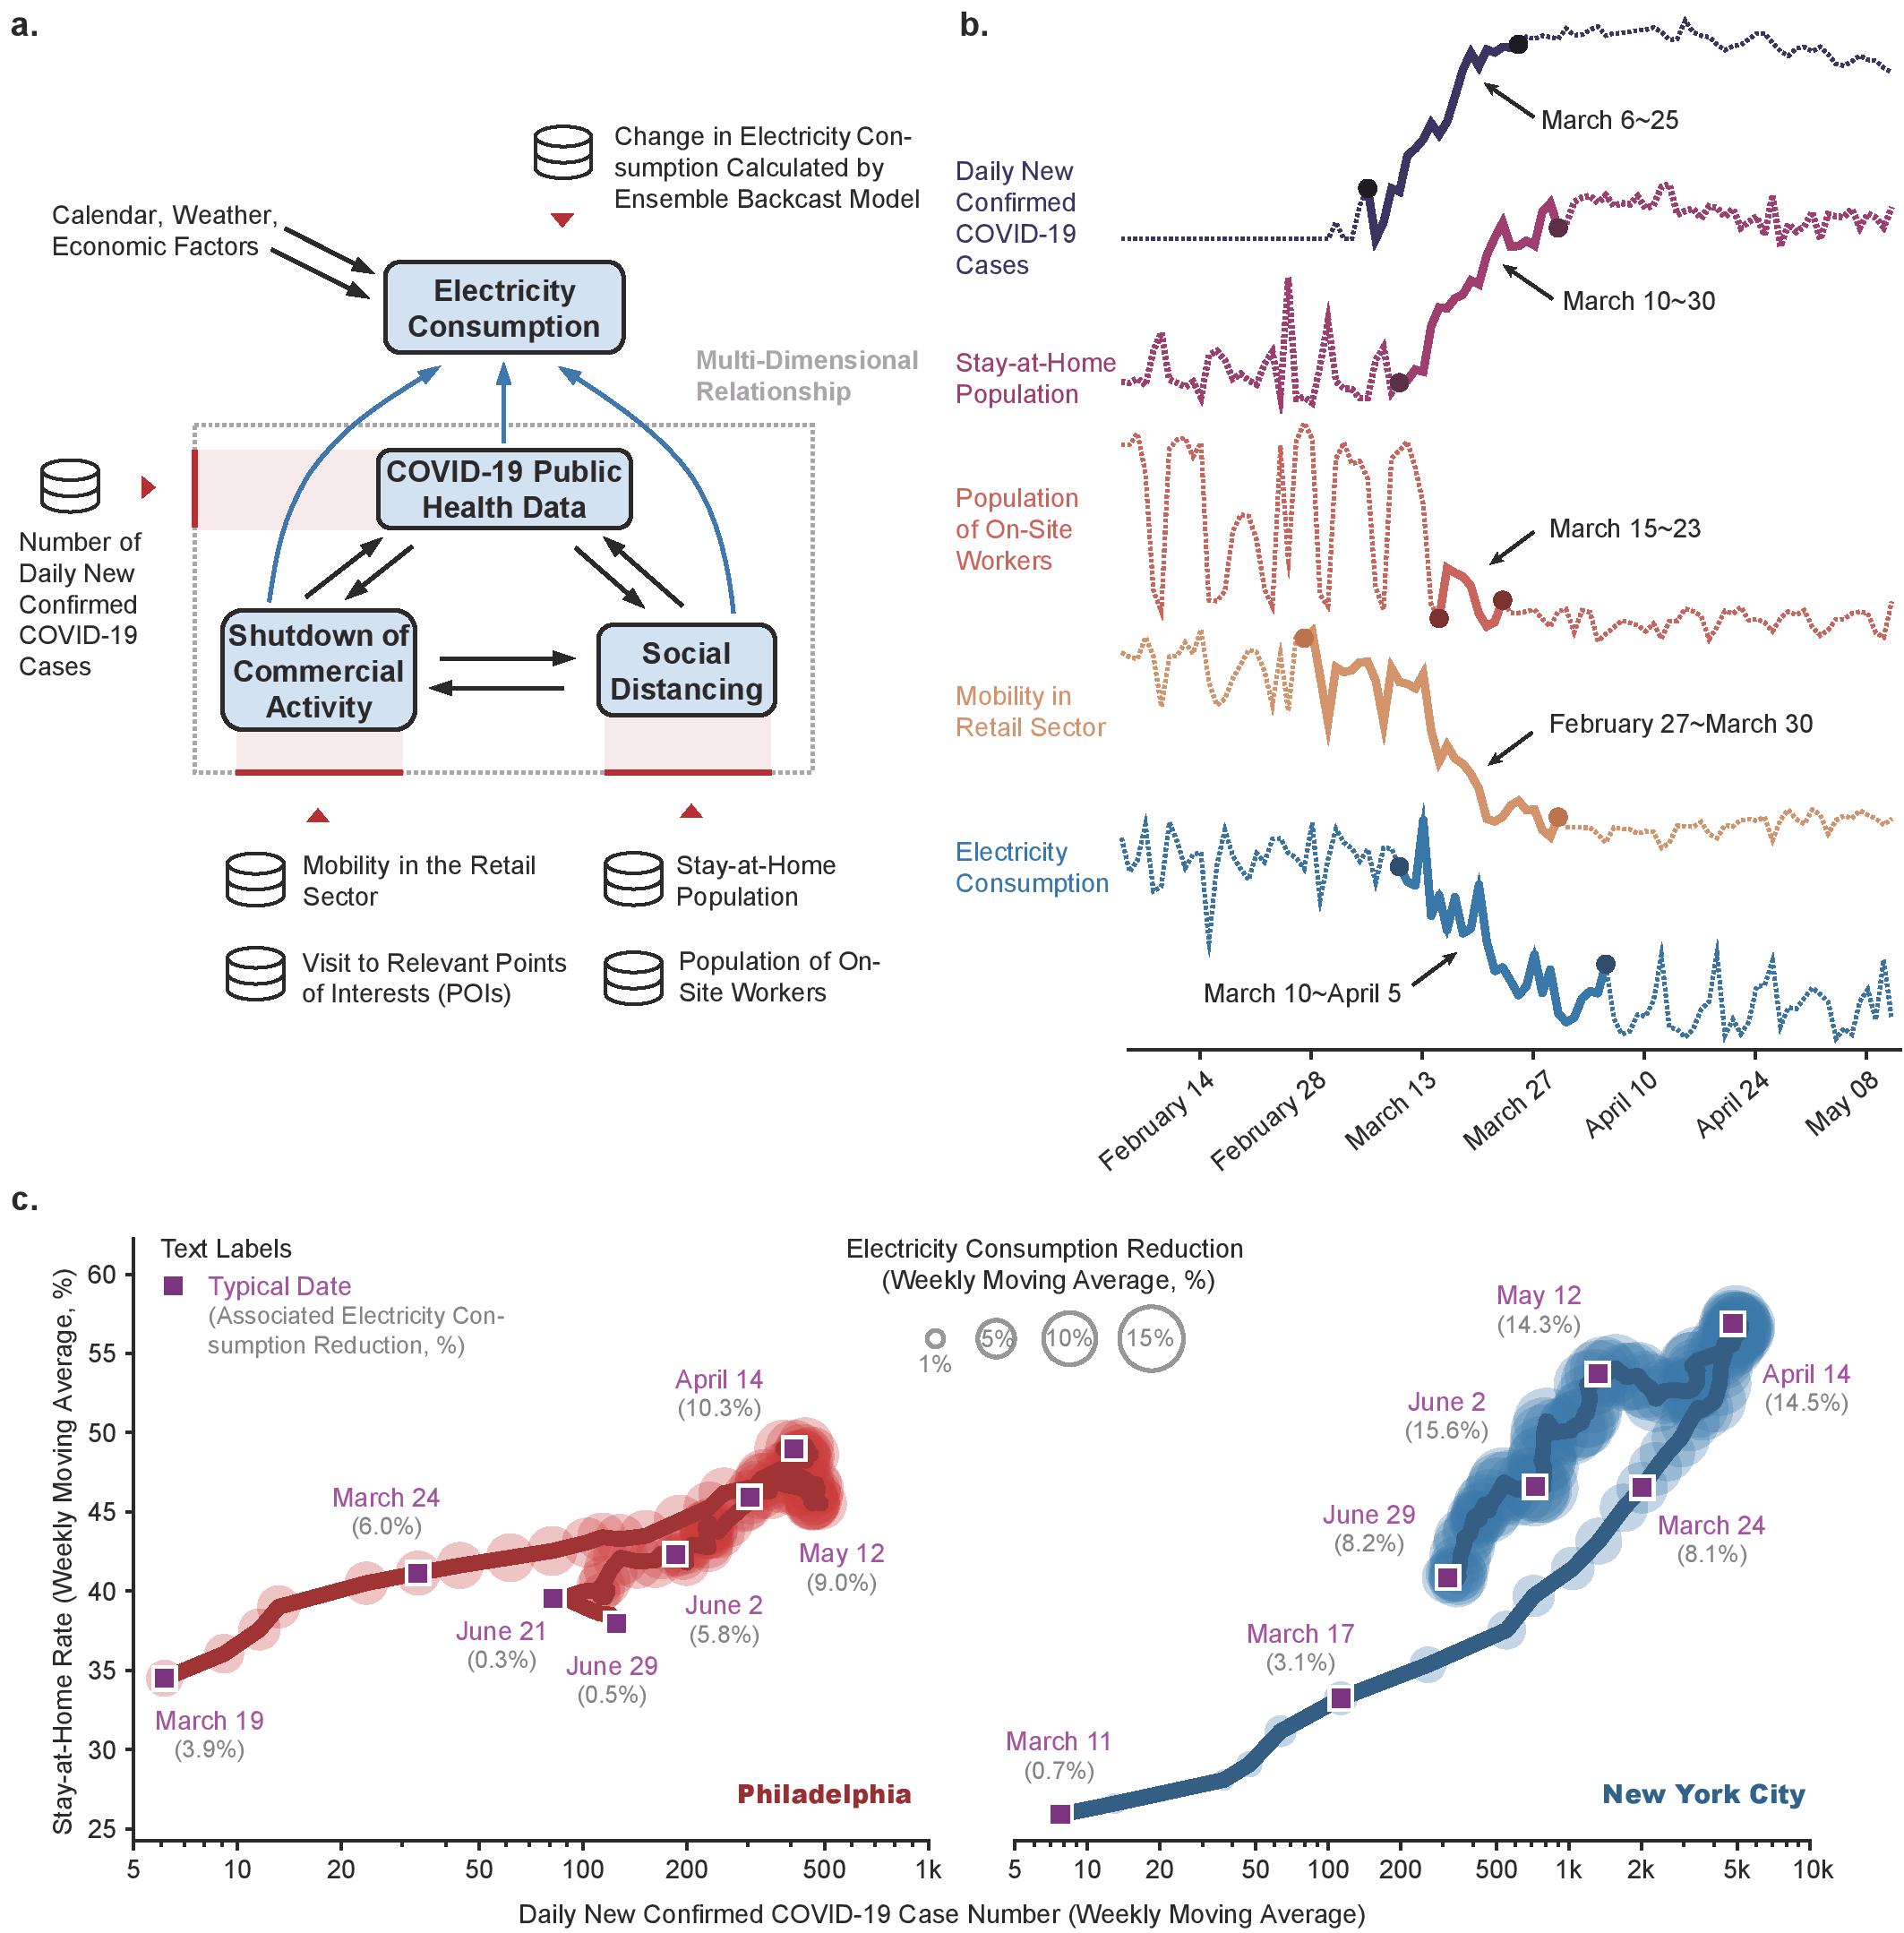
- Develop an ensemble backcast model to estimate pre-COVID electricity consumption considering weather, calendar, and GDP growth factors.
- Calibrate city-specific Restricted Vector Autoregression (VAR) models to analyze multi-factor influences on electricity consumption and perform variance decomposition and impulse response analyses.
- Use geocoding and data harmonization to align heterogeneous data sources to common temporal and geographic resolutions.
- Evaluate cross-market and cross-city electricity consumption reductions (April–June 2020) and relate them to cross-domain factors.
Experimental results
Research questions
- RQ1How did COVID-19, social distancing, and retail mobility relate to changes in U.S. electricity consumption across markets and cities?
- RQ2What is the relative importance of public health metrics, social distancing indicators, and commercial activity in explaining load reductions?
- RQ3Do dynamic time-scale differences across factors (top-down vs bottom-up responses) produce delayed effects on electricity consumption?
- RQ4Can cross-domain data improve short-run load forecasting and policy assessment during the pandemic?
Key findings
- All U.S. electricity markets showed reductions in April and May 2020, ranging from 6.36% to 10.24% (April) and 4.44% to 10.71% (May).
- New York ISO (NYISO) and MISO experienced the largest reductions, while ERCOT and SPP showed smaller reductions.
- Retail mobility (commercial activity) is the most significant and robust factor influencing load reductions across cities, with quantified sensitivity in various markets (e.g., Houston: 1% retail mobility decrease ≈ 0.78% steady-state load decrease).
- The number of new COVID-19 cases shows weaker direct impact on consumption in impulse responses, suggesting indirect effects through social distancing and commercial activity.
- City-level analyses reveal dense urban areas (e.g., NYC, Boston) suffered larger reductions than dispersed regions (e.g., Houston).
- Cross-domain insights reveal heterogeneous, region-specific dynamics and the necessity of location-calibrated analyses for policy and operation decisions.
Better researchstarts right now
From paper design to paper writing, dramatically reduce your research time.
No credit card · Free plan available
This review was created by AI and reviewed by human editors.