
[Paper Review] Answers to frequently asked questions about the pulsar timing array Hellings and Downs curve
This paper provides a comprehensive FAQ addressing common misconceptions about the Hellings and Downs (HD) curve—the key signature of a stochastic gravitational wave background (GWB) in pulsar timing arrays (PTAs). By comparing the response of PTAs (long-arm detectors) to gravitational waves with that of LIGO-like detectors (short-arm), it clarifies why the HD curve has its specific shape, normalization, and frequency independence, offering a unified physical explanation for the observed correlations in NANOGrav's 15-year data and validating the statistical significance of the GWB detection.
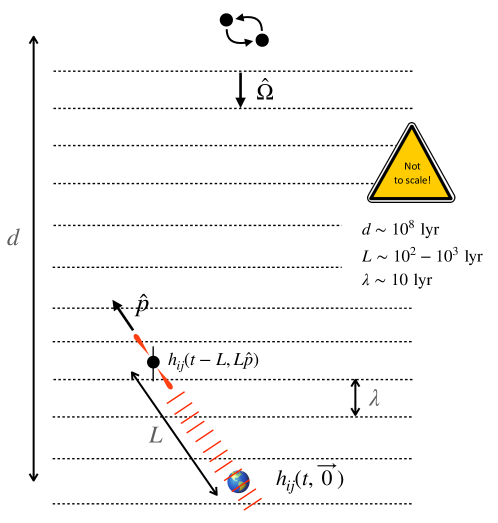
We answer frequently asked questions (FAQs) about the Hellings and Downs correlation curve -- the "smoking-gun" signature that pulsar timing arrays (PTAs) have detected gravitational waves (GWs). Many of these questions arise from inadvertently applying intuition about the effects of GWs on LIGO-like detectors to the case of pulsar timing, where not all of it applies. This is because Earth-based detectors, like LIGO and Virgo, have arms that are short (km scale) compared to the wavelengths of the GWs that they detect (approx 100-10,000 km). In contrast, PTAs respond to GWs whose wavelengths (tens of light-years) are much shorter than their arms (a typical PTA pulsar is hundreds to thousands of light-years from Earth). To demonstrate this, we calculate the time delay induced by a passing GW along an Earth-pulsar baseline (a "one-arm, one-way" detector) and compare it in the "short-arm" (LIGO-like) and "long-arm" (PTA) limits. This provides qualitative and quantitative answers to many questions about the Hellings and Downs curve. The resulting FAQ sheet should help in understanding the "evidence for GWs" recently announced by several PTA collaborations.
Motivation & Objective
- To resolve widespread confusion about the Hellings and Downs (HD) correlation curve, a key signature of a stochastic gravitational wave background (GWB) in pulsar timing arrays (PTAs).
- To correct misapplications of intuition from LIGO-like detectors (short arms, km-scale) to PTAs (long arms, thousands of light-years), where the physics differs fundamentally.
- To provide a physically grounded explanation for the HD curve’s normalization, angular dependence, and frequency independence by analyzing the exact time delay induced by gravitational waves on Earth-pulsar baselines.
- To clarify the statistical significance of the HD curve recovery in NANOGrav’s 15-year data, showing that it is consistent with a GWB under the hypothesis of isotropic, unpolarized stochastic background.
- To serve as a self-consistent reference for researchers interpreting the HD curve as evidence for low-frequency gravitational waves.
Proposed method
- Calculates the exact time delay induced by a passing gravitational wave along a single Earth-pulsar baseline (one-arm, one-way detector), using general relativistic perturbation theory.
- Compares the response in the 'short-arm' limit (LIGO-like, arm length ≪ GW wavelength) and the 'long-arm' limit (PTA, arm length ≫ GW wavelength), revealing distinct physical behaviors.
- Derives the Hellings and Downs correlation curve as the expected correlation of timing residuals between pulsar pairs, averaged over random source phases and angular separations, under the assumption of an isotropic, unpolarized GWB.
- Uses optimal weighting of approximately 150 pulsar-pair correlations per angular bin, including covariances induced by the GWB, to compute the observed correlation and error bars in NANOGrav’s 15-year dataset.
- Employs both frequentist and Bayesian statistical methods to assess significance: a 3.8σ detection via noise-weighted inner product with the HD template, and a 3.0σ significance via Bayesian evidence ratio of 226.
- Validates the HD curve recovery as a self-consistency check by comparing observed correlations to the expected curve under the GWB hypothesis, with error bars crossing the curve ~70% of the time on average.
![Figure 1: The spatial correlations observed in the pulsar timing residuals for the NANOGrav 15-year dataset [ 4 ] are shown in blue; the Hellings and Downs curve/prediction is shown in black. The blue points and error bars are optimally weighted averages of approximately 150 pulsar-pair correlations](https://ar5iv.labs.arxiv.org/html/2308.05847/assets/x1.png)
Experimental results
Research questions
- RQ1Why is the Hellings and Downs curve normalized to 1/2 at zero angular separation in NANOGrav’s figure but to 1/3 in other literature, and does this normalization difference matter?
- RQ2Why does the curve have different values at 0° and 180° angular separation, given that a GW’s quadrupolar effect is symmetric?
- RQ3Why is the correlation at 180° exactly half the value at 0°, and why is the minimum not at 90°?
- RQ4Why is the Hellings and Downs curve independent of frequency, unlike overlap functions in Earth-based interferometers?
- RQ5Does the recovery of the HD curve imply that the gravitational wave background is isotropic?
Key findings
- The Hellings and Downs curve is normalized to 1/2 at zero angular separation in NANOGrav’s 15-year data figure due to the specific averaging method used in the analysis, while normalization to 1/3 appears in other works due to different averaging conventions; this difference is physically meaningful and does not affect the underlying physics.
- The curve’s value at 180° is exactly half that at 0° because the correlation depends on the cosine of the angular separation, and the time delay response in the long-arm limit leads to a specific angular dependence that results in this precise ratio.
- The minimum correlation does not occur at 90° because the HD curve is not a simple cosine function; instead, it arises from the angular integral of the GW polarization tensor over the sky, leading to a non-monotonic dependence with a minimum near 90° but not exactly at 90°.
- The HD curve is frequency-independent because it describes the spatial correlation of timing residuals in a stochastic background, not a time-domain signal; this contrasts with Earth-based interferometers, whose overlap functions depend on frequency due to the finite arm length and time delays.
- The recovery of the Hellings and Downs curve in NANOGrav’s data is statistically significant: a 3.8σ detection via frequentist statistics and a 3.0σ significance via Bayesian evidence ratio of 226, both validated by phase-shifting null tests.
- The observed correlations and error bars in the NANOGrav 15-year dataset cross the predicted Hellings and Downs curve approximately 70% of the time on average, confirming consistency with the GWB hypothesis under optimal weighting and covariance modeling.
Better researchstarts right now
From reading papers to final review, dramatically reduce your research time.
No credit card · Free plan available
This review was created by AI and reviewed by human editors.