
[Paper Review] Far-Ultraviolet to Near-Infrared Observations of SN 2023ixf: A high energy explosion engulfed in complex circumstellar material
This study presents multi-wavelength photometric and spectroscopic observations of SN 2023ixf from far-ultraviolet to near-infrared within days of explosion, revealing a high-energy Type II supernova interacting with a dense, shell-shaped circumstellar medium (CSM) formed by enhanced mass loss 35–65 years prior. The key finding is that the luminous light curve and multi-peaked Hα emission are driven by a combination of energetic explosion and ongoing CSM interaction, with the CSM confined to ~75–140 AU and mass loss rate ~10⁻³.⁰±⁰.⁵ M☉ yr⁻¹.
We present early-phase panchromatic photometric and spectroscopic coverage spanning far-ultraviolet (FUV) to the near-infrared (NIR) regime of the nearest hydrogen-rich core-collapse supernova in the last 25 years, SN 2023ixf. We observe early 'flash' features in the optical spectra due to a confined dense circumstellar material (CSM). We observe high-ionization absorption lines (FeII, MgII) in the ultraviolet spectra from very early on. We also observe a multi-peaked emission profile of H-alpha in the spectrum beginning ~16 d, which indicates ongoing interaction of the SN ejecta with a pre-existing shell-shaped CSM having an inner radius of ~75 AU and an outer radius of ~140 AU. The shell-shaped CSM is likely a result of enhanced mass loss ~35-65 years before the explosion assuming a standard Red-Supergiant wind. The UV spectra are dominated by multiple highly ionized narrow absorption features and broad emission features from elements such as C, N, O, Si, Fe, and Ni. Based on early light curve models of Type II SNe, we infer that the nearby dense CSM confined to (7+-3)e14cm (~45 AU) is a result of enhanced mass loss (10^{-3.0+-0.5} Msol/yr) two decades before the explosion.
Motivation & Objective
- To understand the origin and properties of dense circumstellar material (CSM) surrounding SN 2023ixf, the nearest core-collapse supernova in 25 years.
- To investigate the role of CSM interaction in shaping the early light curve and spectral evolution of SN 2023ixf.
- To constrain the mass loss history of the progenitor star using multi-wavelength data, particularly from UV to NIR.
- To disentangle the contributions of explosion energy and CSM interaction to the unusually high peak luminosity (MV ≈ -18.1 mag).
Proposed method
- Conducted panchromatic photometric and spectroscopic monitoring from far-ultraviolet (FUV) to near-infrared (NIR) within 2 days of explosion using ground-based telescopes (HCT, GIT, KT) and space-based observatories (Swift, AstroSat).
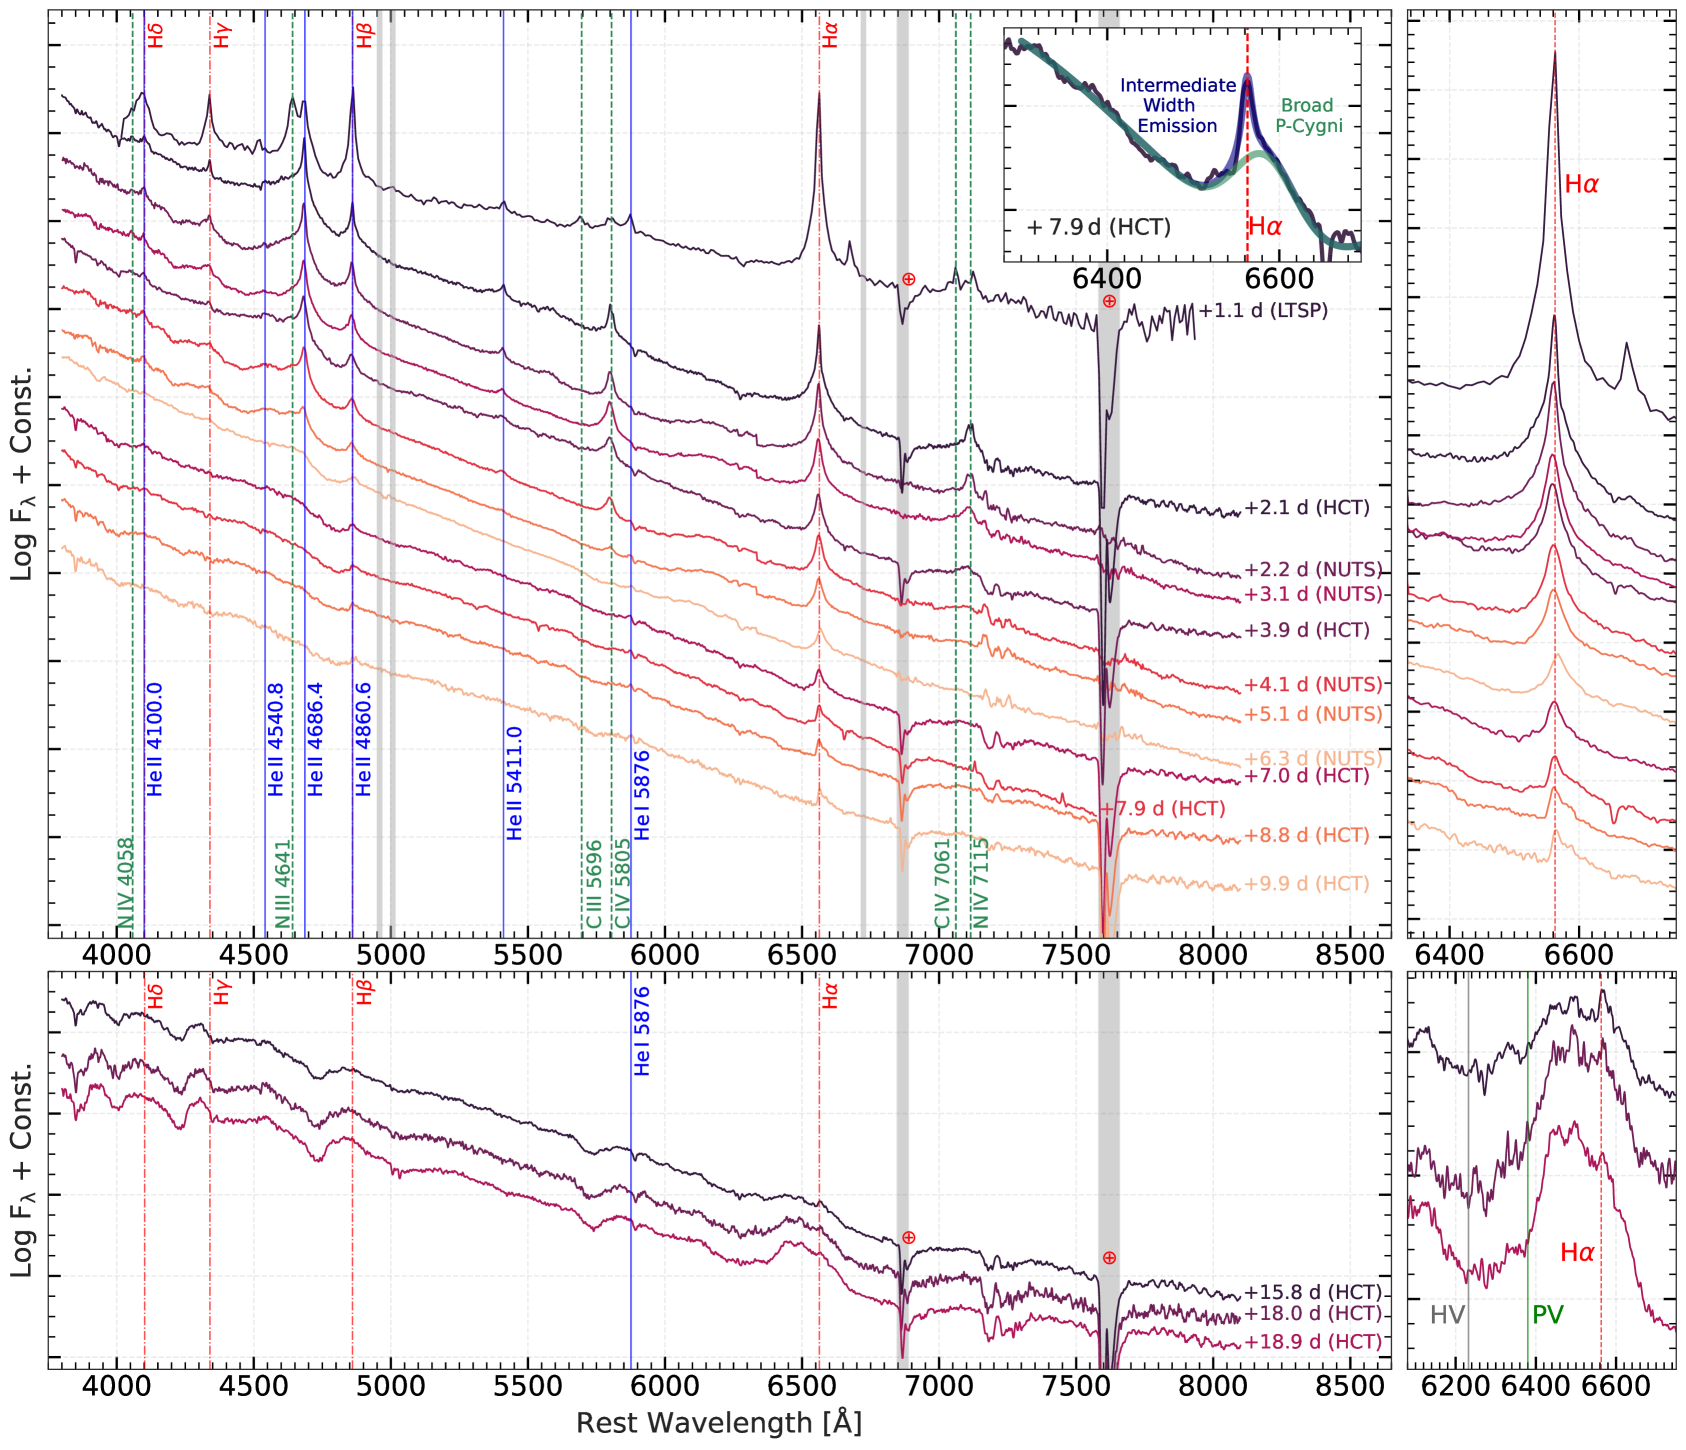
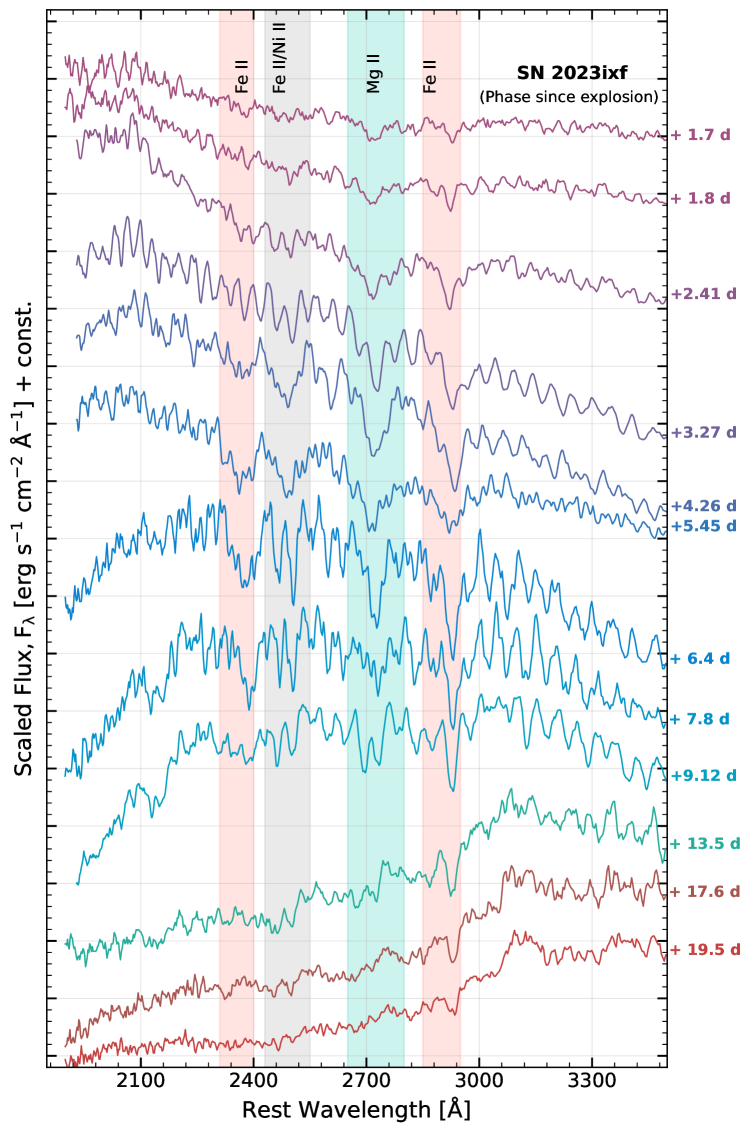
- Identified early flash features in optical and UV spectra, including high-ionization lines (Fe II, Mg II) and broad emission lines (C, N, O, Si, Fe, Ni), indicating ionization by shock breakout and ongoing interaction.
- Analyzed the multi-peaked Hα profile starting at ~16 days post-explosion to infer a shell-shaped CSM with inner radius ~75 AU and outer radius ~140 AU.
- Used a large grid of theoretical light curve models for interacting Type II SNe to infer CSM properties, including density and mass loss rate.
- Applied standard red supergiant (RSG) wind models to estimate the progenitor’s enhanced mass loss episode ~35–65 years before explosion.
- Compared observed light curves with model grids to constrain the relative contributions of explosion energy and CSM interaction to the peak luminosity.
Experimental results
Research questions
- RQ1What is the origin and structure of the dense circumstellar material (CSM) surrounding SN 2023ixf, and when did it form?
- RQ2How does the interaction between the supernova ejecta and the CSM influence the early light curve and spectral evolution of SN 2023ixf?
- RQ3What was the mass loss rate and timescale of the progenitor’s enhanced mass loss episode prior to explosion?
- RQ4To what extent is the unusually high peak luminosity of SN 2023ixf (MV ≈ -18.1 mag) due to CSM interaction versus intrinsic explosion energy?
- RQ5What is the physical geometry of the CSM, and how does it affect the observed multi-peaked Hα emission profile?
Key findings
- Early UV and optical spectra show persistent high-ionization absorption lines (Fe II, Mg II) and broad emission features from C, N, O, Si, Fe, and Ni, indicating ionization by shock breakout and ongoing CSM interaction.
- A multi-peaked Hα emission profile appears at ~16 days post-explosion, indicating ongoing interaction with a shell-shaped CSM extending from ~75 AU to ~140 AU from the progenitor.
- The CSM is consistent with a mass loss episode of ~10⁻³.⁰±⁰.⁵ M☉ yr⁻¹ occurring ~35–65 years before explosion, assuming a standard RSG wind.
- The nearby dense CSM is confined to ~7±3×10¹⁴ cm (~45 AU), as inferred from early light curve modeling and flash feature decay timescales.
- The peak luminosity of MV ≈ -18.1 mag is significantly higher than the typical Type II SN (MV ≈ -16.7 mag), and is likely due to a combination of high explosion energy and CSM interaction.
- Light curve modeling suggests that both the energetic explosion and CSM interaction contribute to the luminosity, but the relative weight of each component remains unconstrained and requires further monitoring.
Better researchstarts right now
From reading papers to final review, dramatically reduce your research time.
No credit card · Free plan available
This review was created by AI and reviewed by human editors.