
[Paper Review] Glucodensity Functional Profiles Outperform Traditional Continuous Glucose Monitoring Metrics
This study introduces glucodensity functional profiles—analyzing glucose speed and acceleration from continuous glucose monitoring (CGM) data—as superior biomarkers for predicting long-term glycemic outcomes. Using functional data analysis on AEGIS cohort data, it demonstrates over 20% improvement in adjusted R² for forecasting HbA1c and fasting plasma glucose compared to traditional metrics, highlighting the clinical value of dynamic glucose metrics beyond standard time-in-range and variability measures.
Continuous glucose monitoring (CGM) data has revolutionized the management of type 1 diabetes, particularly when integrated with insulin pumps to mitigate clinical events such as hypoglycemia. Recently, there has been growing interest in utilizing CGM devices in clinical studies involving healthy and diabetes populations. However, efficiently exploiting the high temporal resolution of CGM profiles remains a significant challenge. Numerous indices -- such as time-in-range metrics and glucose variability measures -- have been proposed, but evidence suggests these metrics overlook critical aspects of glucose dynamic homeostasis. As an alternative method, this paper explores the clinical value of glucodensity metrics in capturing glucose dynamics -- specifically the speed and acceleration of CGM time series -- as new biomarkers for predicting long-term glucose outcomes. Our results demonstrate significant information gains, exceeding 20\% in terms of adjusted $R^2$, in forecasting glycosylated hemoglobin (HbA1c) and fasting plasma glucose (FPG) at five and eight years from baseline AEGIS data, compared to traditional non-CGM and CGM glucose biomarkers. These findings underscore the importance of incorporating more complex CGM functional metrics, such as the glucodensity approach, to fully capture continuous glucose fluctuations across different time-scale resolutions.
Motivation & Objective
- To address the limitations of traditional CGM metrics, which overlook dynamic glucose fluctuations such as speed and acceleration.
- To evaluate whether glucodensity functional profiles—capturing glucose dynamics across time scales—improve prediction of long-term glycemic outcomes.
- To demonstrate the clinical utility of functional data analysis in leveraging high-resolution CGM data for better risk stratification in diabetes prevention.
- To establish glucose speed and acceleration as novel, interpretable biomarkers for metabolic health beyond average glucose or variability measures.
Proposed method
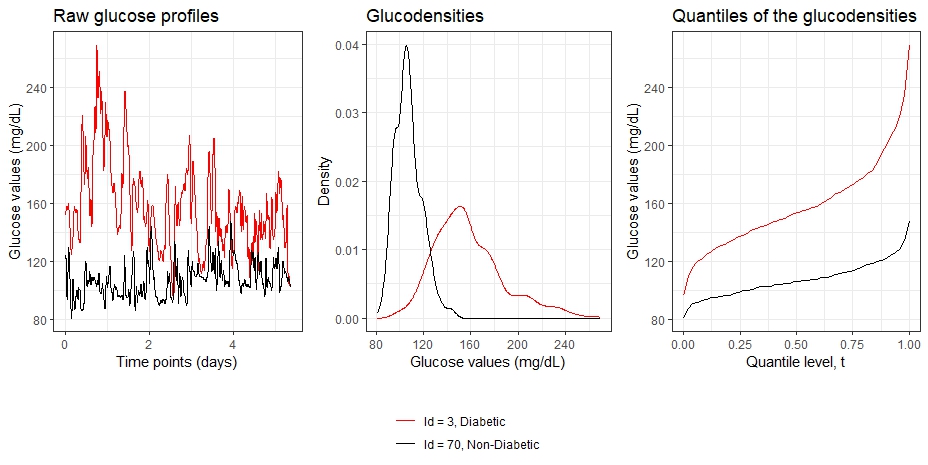
- The study employs functional data analysis to model continuous glucose time series as smooth functions, extracting speed (first derivative) and acceleration (second derivative) from CGM data.
- Glucodensity profiles are constructed to represent the distribution of glucose values across time, capturing both marginal and multivariate functional dynamics.
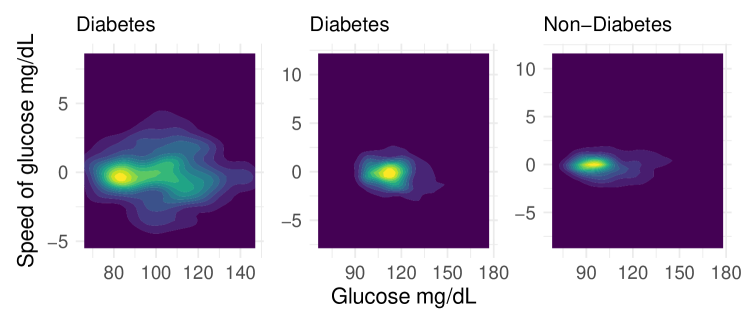
- Multivariate glucodensity models simultaneously analyze glucose levels, speed, and acceleration as functional predictors in regression models.
- The approach uses functional linear models with penalized splines to estimate smooth curves from irregularly spaced, high-resolution CGM data.
- Model performance is evaluated using adjusted R² to compare predictive power for HbA1c and fasting plasma glucose at 5- and 8-year follow-up.
- The analysis is conducted on the AEGIS cohort, a large observational study with 10-year follow-up, enabling long-term outcome prediction.
Experimental results
Research questions
- RQ1Can glucodensity functional profiles that incorporate glucose speed and acceleration predict long-term HbA1c and fasting plasma glucose more accurately than traditional CGM metrics?
- RQ2Does the inclusion of dynamic glucose metrics—beyond time-in-range and variability—improve the explained variance in long-term glycemic outcomes?
- RQ3How does functional data analysis enhance the interpretation and predictive power of CGM data compared to standard summary statistics?
- RQ4To what extent do glucose speed and acceleration serve as independent biomarkers for metabolic deterioration in pre-diabetic and normoglycemic individuals?
Key findings
- The multivariate glucodensity model, incorporating glucose speed and acceleration, improved adjusted R² by over 20% in predicting HbA1c and fasting plasma glucose at 5- and 8-year follow-up compared to traditional CGM metrics.
- The glucodensity approach significantly outperformed standard biomarkers such as time-in-range and glucose variability indices in forecasting long-term glycemic control.
- Functional data analysis enabled robust modeling of high-resolution, irregularly sampled CGM data, capturing dynamic glucose changes across multiple time-scale resolutions.
- The study confirms that glucose dynamics—particularly speed and acceleration—carry independent predictive information for future glucose outcomes, even after adjusting for average glucose levels.
- The results support the use of glucodensity metrics as more powerful and interpretable biomarkers than conventional CGM indices in clinical and preventive diabetes research.
- The findings suggest that next-generation insulin trials and preventive interventions could benefit from incorporating functional glucose dynamics to improve outcome prediction and personalization.
Better researchstarts right now
From reading papers to final review, dramatically reduce your research time.
No credit card · Free plan available
This review was created by AI and reviewed by human editors.