[Paper Review] JADES NIRSpec Spectroscopy of GN-z11: Lyman-$α$ emission and possible enhanced nitrogen abundance in a $z=10.60$ luminous galaxy
The paper reports JWST/NIRSpec spectroscopy of GN-z11, confirming a redshift z=10.6034 and revealing Lyman-α emission with a 555 km/s offset, plus detailed rest-UV line diagnostics suggesting high ionization and possible enhanced nitrogen abundance. It discusses whether the source is powered by star formation or AGN activity and infers physical properties like SFR and metallicity.
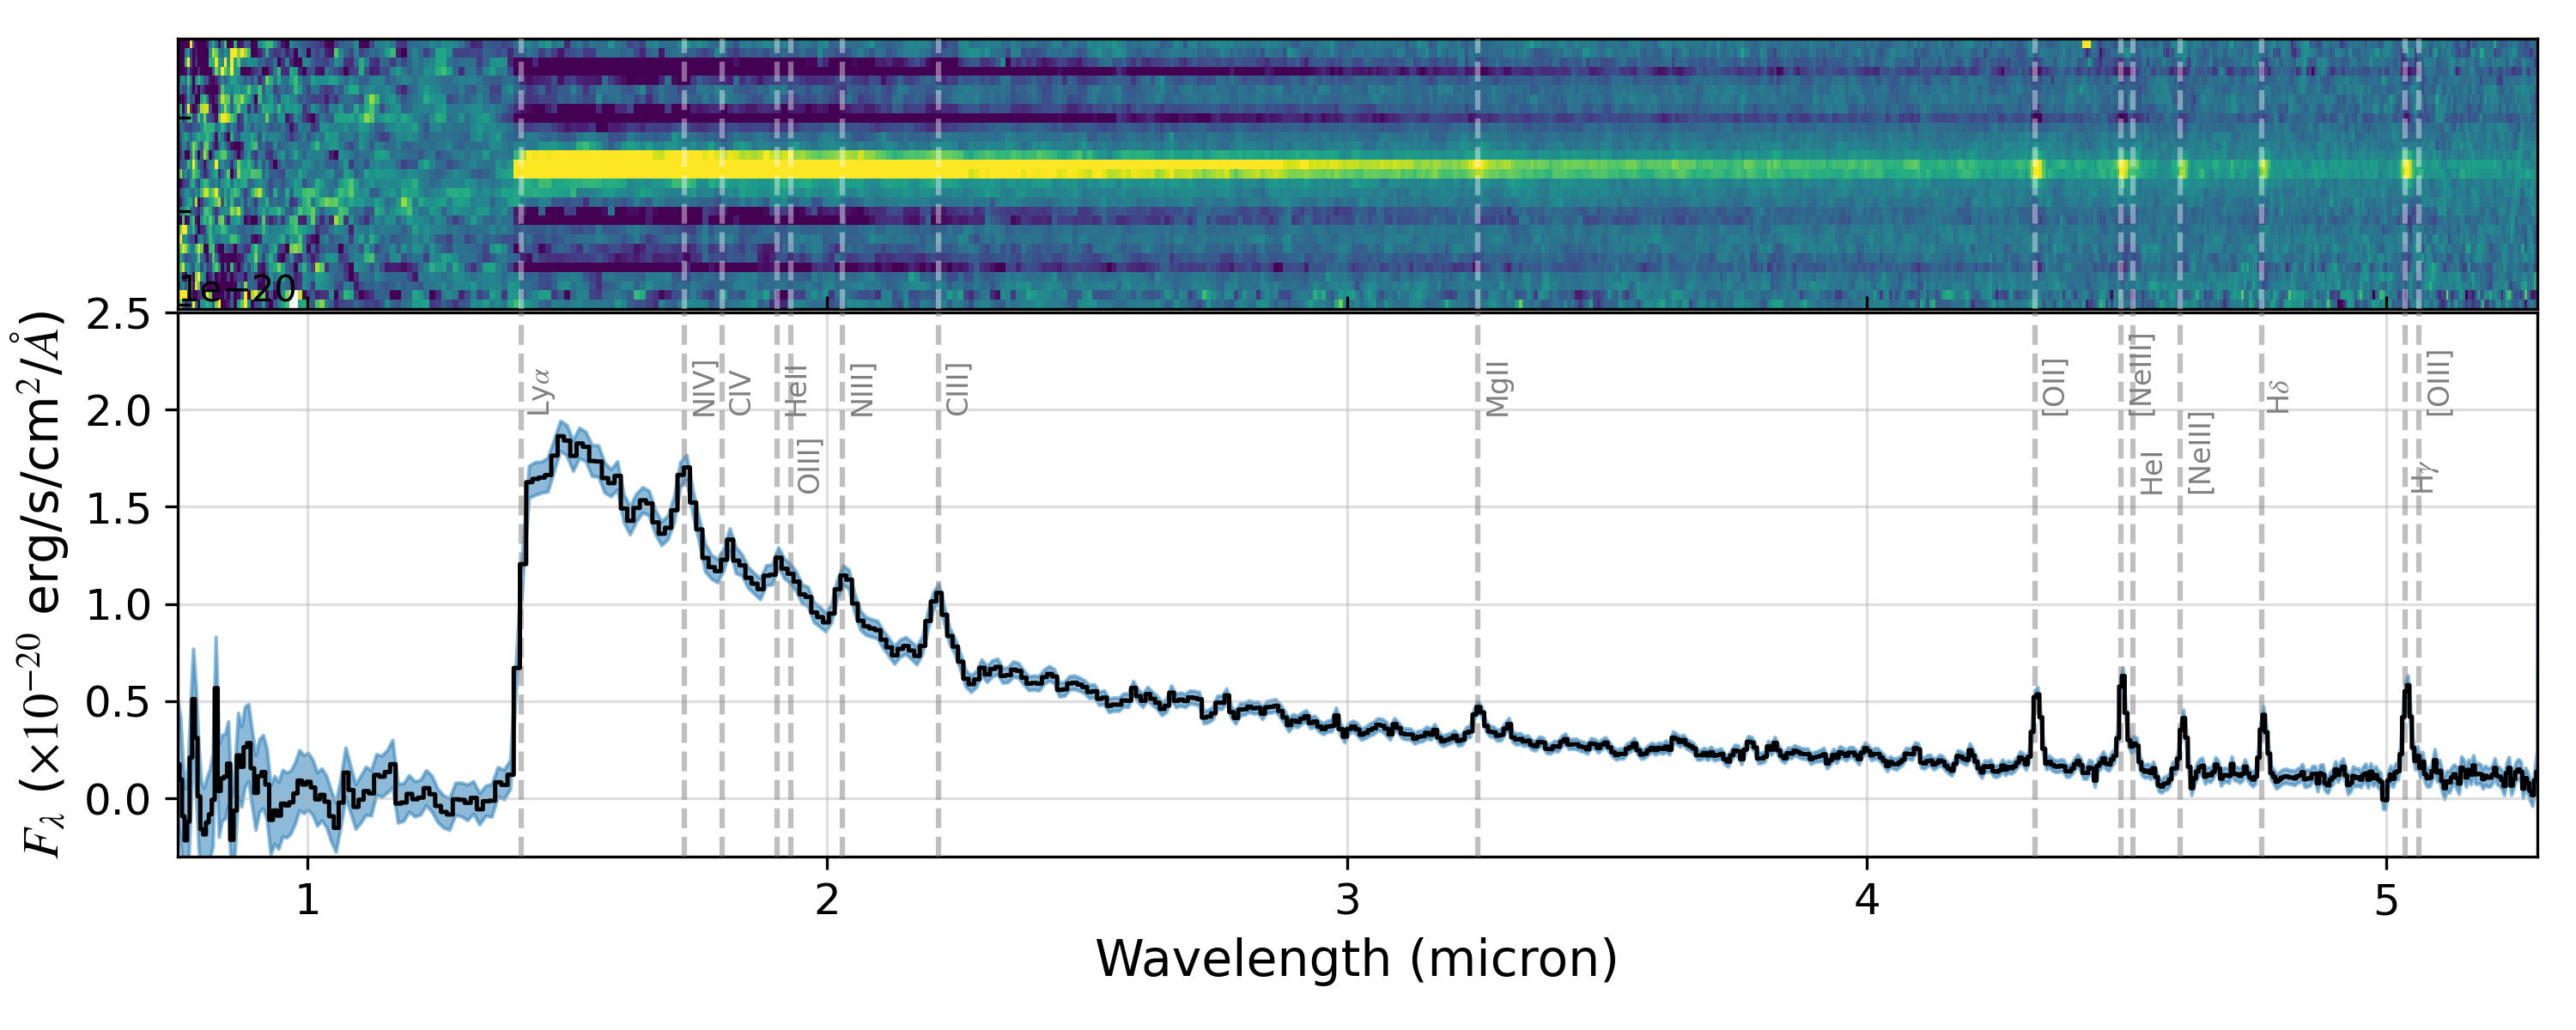
We present JADES JWST/NIRSpec spectroscopy of GN-z11, the most luminous candidate $z>10$ Lyman break galaxy in the GOODS-North field with $M_{UV}=-21.5$. We derive a redshift of $z=10.603$ (lower than previous determinations) based on multiple emission lines in our low and medium resolution spectra over $0.8-5.3 μ$m. We significantly detect the continuum and measure a blue rest-UV spectral slope of $β=-2.4$. Remarkably, we see spatially-extended Lyman-$α$ in emission (despite the highly-neutral IGM expected at this early epoch), offset 555 km s$^{-1}$ redward of the systemic redshift. From our measurements of collisionally-excited lines of both low- and high-ionization (including [O II]$\lambda3727$, [Ne III]$λ3869$ and C III]$\lambda1909$) we infer a high ionization parameter ($\log U\sim -2$). We detect the rarely-seen N IV]$\lambda1486$ and N III]$\lambda1748$ lines in both our low and medium resolution spectra, with other high ionization lines seen in the low resolution spectrum such as He II (blended with O III]) and C IV (with a possible P-Cygni profile). Based on the observed rest-UV line ratios, we cannot conclusively rule out photoionization from AGN, although the high C III]/He II and N III]/He II ratios are compatible with a star-formation explanation. If the observed emission lines are powered by star formation, then the strong N III]$\lambda1748$ observed may imply an unusually high $N/O$ abundance. Balmer emission lines (H$γ$, H$δ$) are also detected, and if powered by star formation rather than an AGN we infer a star formation rate of $\sim 20-30 M_{\odot} yr^{-1}$ (depending on the IMF) and low dust attenuation. Our NIRSpec spectroscopy confirms that GN-z11 is a remarkable galaxy with extreme properties seen 430 Myr after the Big Bang.
Motivation & Objective
- Confirm the precise spectroscopic redshift of GN-z11 using JWST/NIRSpec across 0.7–5.3 μm.
- Characterize rest-UV and optical emission lines to diagnose ionization source (AGN vs. star formation) and ISM properties.
- Measure Lyman-α properties including flux, EW, and spatial extent, and assess IGM transmission at z>10.
- Infer physical properties such as ionization parameter, metallicity, and star-formation rate from line diagnostics and SED fitting.
Proposed method
- Obtain deep JWST/NIRSpec observations in MSA mode using four configurations across G140M, G235M, G395M, and PRISM/CLEAR.
- Extract and calibrate 1D/2D spectra, fit emission lines with Gaussian profiles, and combine results across configurations.
- Use line fluxes and ratios (e.g., C III], N III], N IV], He II, C IV, [O II], [Ne III]) to compare with photoionization models (AGN vs. star formation) and assess ionization conditions.
- Apply BEAGLE SED fitting to the full prism spectrum to infer gas-phase metallicity and star-formation properties.
- Determine Lyman-α properties (flux, EW, spatial extent) and measure velocity offset relative to systemic redshift.
Experimental results
Research questions
- RQ1What is the precise systemic redshift of GN-z11 as measured by rest-frame optical/UV emission lines?
- RQ2Do the rest-UV line ratios and high-ionization lines favor AGN photoionization or star-formation-driven ionization in GN-z11?
- RQ3What are the Lyman-α properties (flux, EW, spatial extent) and what do they imply about IGM transmission at z>10?
- RQ4What do the emission lines reveal about ionization parameter, metallicity, and potential nitrogen enrichment in GN-z11?
- RQ5Is GN-z11 consistent with being AGN-dominated or star-formation-dominated given the data?
Key findings
- GN-z11 is at z=10.6034 ± 0.0013 based on eight well-detected lines from grating spectra.
- Lyman-α is detected with a velocity offset of 555 ± 32 km s−1 redward of systemic redshift and shows spatial extension beyond the continuum.
- Detected lines include N IV] 1486, N III] 1749, C III] 1907+1909, [O II] 3726,29, Ne III] 3869, Hδ, Hγ, with C IV showing a P-Cygni profile and He II blended with O III].
- Line ratio diagnostics place GN-z11 between AGN and star-formation models; no conclusive dominance of AGN is established, though high-ionization lines are present.
- If powered by star formation, the strong N III] 1748 may indicate unusually high N/O abundance; Balmer lines imply SFR ≈ 20–30 M⊙ yr−1 (depends on IMF) and low dust attenuation.
- Lyman-α escape fraction is inferred as ≈0.038 ± 0.004 given Ly-α and Balmer line fluxes under Case B recombination.
Better researchstarts right now
From paper design to paper writing, dramatically reduce your research time.
No credit card · Free plan available
This review was created by AI and reviewed by human editors.