
[Paper Review] Little Red Dots at an Inflection Point: Ubiquitous "V-Shaped" Turnover Consistently Occurs at the Balmer Limit
The study analyzes extremely red H-alpha emitters (Little Red Dots) using RUBIES and public PRISM spectra, fitting broken power laws to find a consistent inflection at the Balmer limit (0.3645 μm) in the rest-frame UV–optical continuum.
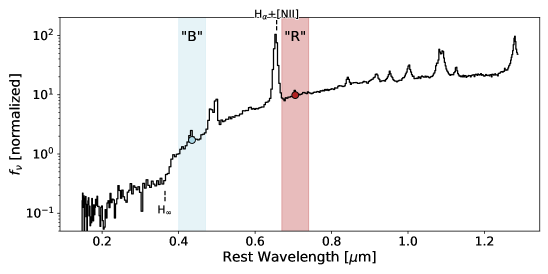
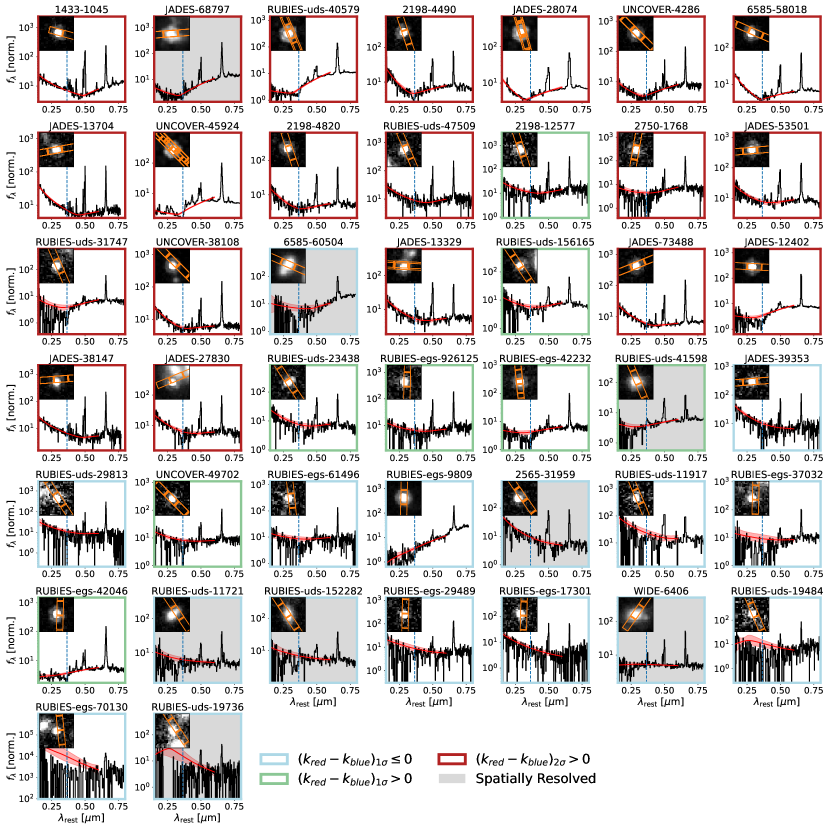
Among the most puzzling early discoveries of JWST are "Little Red Dots" -- compact red sources that host broad Balmer emission lines and, in many cases, exhibit a "V shaped" change in slope in the rest-optical. The physical properties of Little Red Dots currently have order-of-magnitude uncertainties, because models to explain the continuum of these sources differ immensely. Here, we leverage the complete selection of red sources in the RUBIES program, supplemented with public PRISM spectra, to study the origin of this "V shape". By fitting a broken power law with a flexible inflection point, we find that a large fraction (20/44, nearly all spatially unresolved) of extremely red H$α$ emitters at $2
Motivation & Objective
- Investigate the continuum shapes of Little Red Dots to understand the origin of their V-shaped turnover.
- Determine whether the inflection point of the V-shape is located near the Balmer limit across a large sample.
- Assess whether the observed spectral features favor stellar-dominated or AGN-dominated continua.
- Evaluate how the continuum inflection relates to rest-frame UV–optical emission and the Balmer series.
- Provide constraints on physical models (stellar populations vs. AGN scenarios) that can reproduce the observed shapes.
Proposed method
- Select an extremely red H-alpha emitter sample from JWST/NIRSpec PRISM spectra (B-R > 0.95; EW(H-α) > 400 Å; mF444W < 26.5).
- Fit a flexible broken power-law continuum to rest-frame 0.15–0.6 μm with parameters for break wavelength and blue/red slopes.
- Use emcee to sample model parameters (normalization, break wavelength, k_blue, k_red) with priors; apply S/N floor and a free white-noise inflation term.
- Mask strong emission features and perform fitting in log(fν) to mitigate negative flux issues and model mismatch.
- Assess inflection strength Δk = k_red − k_blue and break location λ_break, including well-determined cases (break width < 750 Å).
- Stack spectra of strong-inflexion sources to examine the aggregate inflection behavior around the Balmer limit.
Experimental results
Research questions
- RQ1Does the extremely red H-alpha emitter population exhibit a common inflection in the rest-frame UV–optical continuum?
- RQ2Is the inflection wavelength consistently located near the Balmer limit at 0.3645 μm across sources?
- RQ3What physical scenarios (stellar-dominated, AGN-dominated, or mixed) can reproduce the observed V-shaped continuum shapes?
- RQ4How does the continuum inflection relate to the presence of Balmer lines and the overall SED?
- RQ5What fraction of the sample shows a statistically significant change in slope and where is it most reliably constrained?
Key findings
- About 20 of 44 extremely red H-alpha emitters (nearly all unresolved) show a strong, statistically significant change in spectral slope.
- The inflection points for strong cases cluster near the Balmer limit at 0.3645 μm (H∞), with many fits placing λ_break close to this value.
- Stacks of the strongest-inflexion sources reveal a pronounced blue slope shortward of the Balmer limit and a diverse red-ward slope, indicating a common Balmer-related transition.
- The inferred Δk = k_red − k_blue is positive for the strong-inflexion population, consistent with a V-shaped continuum, and appears robust against model variations.
- Simple toy models show that a purely power-law AGN continuum would struggle to produce the observed Balmer-limit inflection unless a Balmer-break-like feature or stellar-dominated component is involved.
- The overall results suggest the inflection is likely due to a single continuum component dominating the rest-UV-to-optical, plausibly linked to T ~ 10^4 K hydrogen features, rather than being a uniform AGN-driven UV tail.
Better researchstarts right now
From reading papers to final review, dramatically reduce your research time.
No credit card · Free plan available
This review was created by AI and reviewed by human editors.