
[Paper Review] On the expressiveness and spectral bias of KANs
This paper theoretically and empirically compares Kolmogorov-Arnold Networks (KANs) and Multi-Layer Perceptrons (MLPs), showing that KANs match or exceed MLPs in expressive power while exhibiting significantly reduced spectral bias. KANs achieve better performance on high-frequency functions and PDEs due to their spline-based, learnable activation functions that enable more balanced frequency learning.
Kolmogorov-Arnold Networks (KAN) \cite{liu2024kan} were very recently proposed as a potential alternative to the prevalent architectural backbone of many deep learning models, the multi-layer perceptron (MLP). KANs have seen success in various tasks of AI for science, with their empirical efficiency and accuracy demostrated in function regression, PDE solving, and many more scientific problems. In this article, we revisit the comparison of KANs and MLPs, with emphasis on a theoretical perspective. On the one hand, we compare the representation and approximation capabilities of KANs and MLPs. We establish that MLPs can be represented using KANs of a comparable size. This shows that the approximation and representation capabilities of KANs are at least as good as MLPs. Conversely, we show that KANs can be represented using MLPs, but that in this representation the number of parameters increases by a factor of the KAN grid size. This suggests that KANs with a large grid size may be more efficient than MLPs at approximating certain functions. On the other hand, from the perspective of learning and optimization, we study the spectral bias of KANs compared with MLPs. We demonstrate that KANs are less biased toward low frequencies than MLPs. We highlight that the multi-level learning feature specific to KANs, i.e. grid extension of splines, improves the learning process for high-frequency components. Detailed comparisons with different choices of depth, width, and grid sizes of KANs are made, shedding some light on how to choose the hyperparameters in practice.
Motivation & Objective
- To theoretically analyze the approximation and representation capabilities of KANs relative to MLPs.
- To investigate the spectral bias phenomenon in KANs versus MLPs, particularly in the context of scientific machine learning.
- To provide empirical and theoretical justification for KANs' observed success in solving PDEs and fitting high-frequency functions.
- To guide hyperparameter selection in KANs by studying the effects of depth, width, and grid size on spectral bias and generalization.
- To explain why KANs are more prone to overfitting and how grid coarsening can mitigate this.
Proposed method
- Prove that any ReLU-activated MLP can be reparameterized as a KAN with comparable parameter count, establishing KANs' equal or greater expressive power.
- Construct an MLP representation of a KAN, showing that the number of parameters increases by a factor proportional to the KAN’s grid size.
- Analyze gradient descent dynamics on a single KAN layer to argue that KANs do not suffer from strong spectral bias toward low frequencies.
- Use numerical experiments on 1D frequency fitting, Gaussian random fields, and 1D Poisson equations with high-frequency solutions to compare spectral bias and generalization.
- Apply grid extension in KANs to refine spline approximations and improve learning of high-frequency components.
- Use LBFGS optimization with mean squared error loss on synthetic and PDE datasets to evaluate training and test performance across architectures and hyperparameters.
Experimental results
Research questions
- RQ1Can KANs approximate any function that an MLP can, and with comparable parameter efficiency?
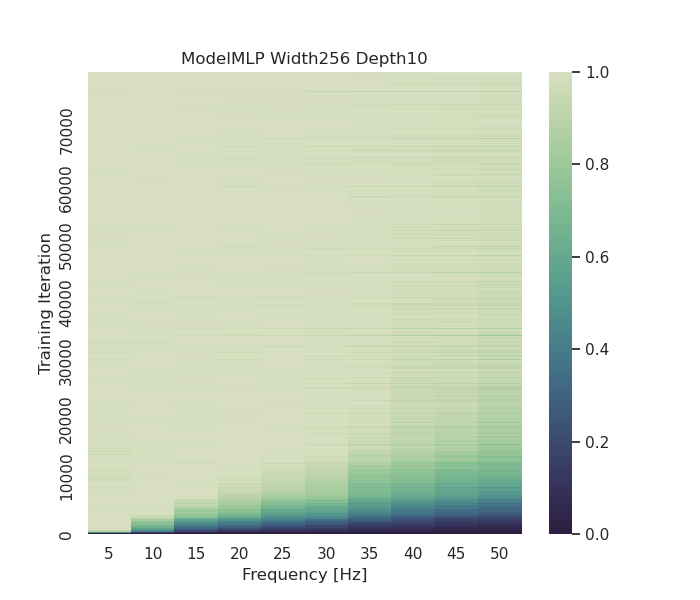
- RQ2How does the spectral bias of KANs compare to that of standard MLPs during training?
- RQ3To what extent does grid extension in KANs improve learning of high-frequency components?
- RQ4Why do KANs exhibit higher overfitting tendencies, and how can this be mitigated through hyperparameter tuning?
- RQ5Does the reduced spectral bias in KANs lead to improved performance on scientific computing tasks such as solving high-frequency PDEs?
Key findings
- KANs can represent any ReLU-activated MLP with a comparable number of parameters, demonstrating that KANs are at least as expressive as MLPs.
- Conversely, representing a KAN using an MLP increases the parameter count by a factor proportional to the KAN’s grid size, suggesting potential efficiency gains for KANs with large grids.
- Theoretical analysis of gradient descent on a single KAN layer indicates that KANs do not exhibit strong spectral bias toward low frequencies, unlike MLPs.
- Empirical results show that KANs consistently outperform MLPs on high-frequency function regression and PDEs, especially as frequency increases.
- KANs are more prone to overfitting on noisy or complex data, but this can be reduced by grid coarsening, which increases spectral bias.
- Increasing training data size significantly reduces KAN overfitting, and grid extension enhances performance on rough or low-scale functions.
Better researchstarts right now
From reading papers to final review, dramatically reduce your research time.
No credit card · Free plan available
This review was created by AI and reviewed by human editors.