[Paper Review] SemEval-2023 Task 10: Explainable Detection of Online Sexism
The paper introduces EDOS, a three-task hierarchical taxonomy for explainable online sexism detection, a 20k-label dataset with diverse platforms, and baseline/participant results highlighting performance gaps and explainability challenges.
Online sexism is a widespread and harmful phenomenon. Automated tools can assist the detection of sexism at scale. Binary detection, however, disregards the diversity of sexist content, and fails to provide clear explanations for why something is sexist. To address this issue, we introduce SemEval Task 10 on the Explainable Detection of Online Sexism (EDOS). We make three main contributions: i) a novel hierarchical taxonomy of sexist content, which includes granular vectors of sexism to aid explainability; ii) a new dataset of 20,000 social media comments with fine-grained labels, along with larger unlabelled datasets for model adaptation; and iii) baseline models as well as an analysis of the methods, results and errors for participant submissions to our task.
Motivation & Objective
- Propose a hierarchical taxonomy for explainable sexism detection (binary, category, and fine-grained vectors).
- Construct a diverse, well-annotated dataset from Reddit and Gab with expert annotators.
- Provide strong baselines and analyze participant methods to identify challenges and error types.
- Evaluate systems on three hierarchical tasks to assess both accuracy and explainability.
Proposed method
- Design a three-level taxonomy: Task A (binary sexism), Task B (4 categories), Task C (11 fine-grained vectors).
- Collect and sample 20k labelled comments from Reddit and Gab using six diverse sampling techniques; supplement with 2M unlabelled in-domain data.
- Annotate with 19 expert female annotators; use adjudication to resolve disagreements; employ expert annotators for low-agreement cases.
- Partition data into train/dev/test (70/10/20) and release unlabelled data for continued pre-training baselines.
- Provide seven baselines (including TF-IDF+XGBoost, DistilBERT, DeBERTa variants) and report macro-F1 across Tasks A–C; enable participant submissions on CodaLab.
- Conduct error analyses (confusion matrices, manual inspection) to understand misclassifications and annotation challenges.
Experimental results
Research questions
- RQ1Can a hierarchical taxonomy improve explainability in automated sexism detection beyond binary labels?
- RQ2What are the performance and error characteristics across Task A (binary), Task B (categories), and Task C (vectors) on diverse social platforms?
- RQ3How does continued pre-training on in-domain unlabelled data affect performance across tasks?
- RQ4What are common error patterns and annotation challenges when labeling nuanced sexism vectors?
Key findings
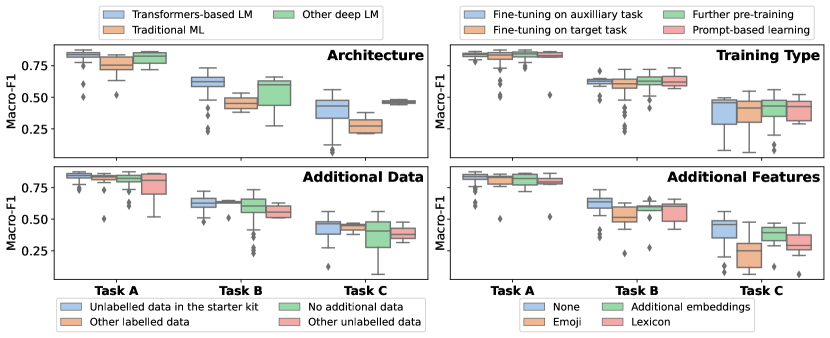
- Task A baseline (DeBERTa-v3) achieved highest macro-F1 around 0.8235, with Task B/C substantially harder (0.5926 and 0.3171 for the baseline).
- Ensembles and continued pre-training on unlabelled in-domain data yielded top results among participant systems.
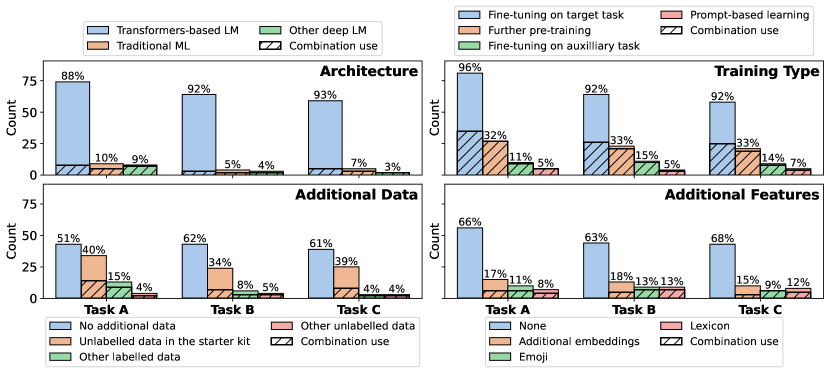
- Transformer-based architectures dominated submissions, with RoBERTa/DeBERTa variants and prompt-based models performing best; additional features rarely improved performance.
- Error analysis showed more false negatives than false positives in Task A, with animosity and derogation driving many misclassifications.
- Fine-grained tasks (B and C) exhibit substantial headroom; max Task C macro-F1 scores hover around 0.32 for baselines and ~0.55–0.60 for top systems on some tasks.
- Annotation quality and contextual nuance remain key challenges, with some human annotation disagreements and grey-area cases.
Better researchstarts right now
From paper design to paper writing, dramatically reduce your research time.
No credit card · Free plan available
This review was created by AI and reviewed by human editors.