
[Paper Review] Socioeconomic biases in urban mixing patterns of US metropolitan areas
This study analyzes socioeconomic biases in urban mobility across the 20 largest U.S. metropolitan areas by combining Foursquare check-in data with American Community Survey data. It reveals strong upward-biased mobility patterns—where individuals predominantly visit places in their own socioeconomic class but occasionally access higher-status venues—indicating deeper mobility-based segregation than residential patterns alone suggest.
Urban areas serve as melting pots of people with diverse socioeconomic backgrounds, who may not only be segregated but have characteristic mobility patterns in the city. While mobility is driven by individual needs and preferences, the specific choice of venues to visit is usually constrained by the socioeconomic status of people. The complex interplay between people and places they visit, given their personal attributes and homophily leaning, is a key mechanism behind the emergence of socioeconomic stratification patterns ultimately leading to urban segregation at large. Here we investigate mixing patterns of mobility in the twenty largest cities of the United States by coupling individual check-in data from the social location platform Foursquare with census information from the American Community Survey. We find strong signs of stratification indicating that people mostly visit places in their own socioeconomic class, occasionally visiting locations from higher classes. The intensity of this `upwards bias' increases with socioeconomic status and correlates with standard measures of racial residential segregation. Our results indicate an even stronger socioeconomic segregation in individual mobility than one would expect from system-level distributions, shedding further light on uneven mobility mixing patterns in cities.
Motivation & Objective
- To investigate how socioeconomic status influences individual mobility patterns and mixing in urban spaces.
- To quantify the extent of upward-biased mobility and its correlation with residential segregation across diverse U.S. metropolitan areas.
- To assess whether mobility patterns reveal stronger socioeconomic stratification than what is captured by static residential segregation metrics.
- To explore the role of homophily and spatial constraints in shaping unequal access to urban venues across socioeconomic classes.
- To examine the interplay between mobility bias, residential segregation, and ethnic clustering in shaping urban inequality.
Proposed method
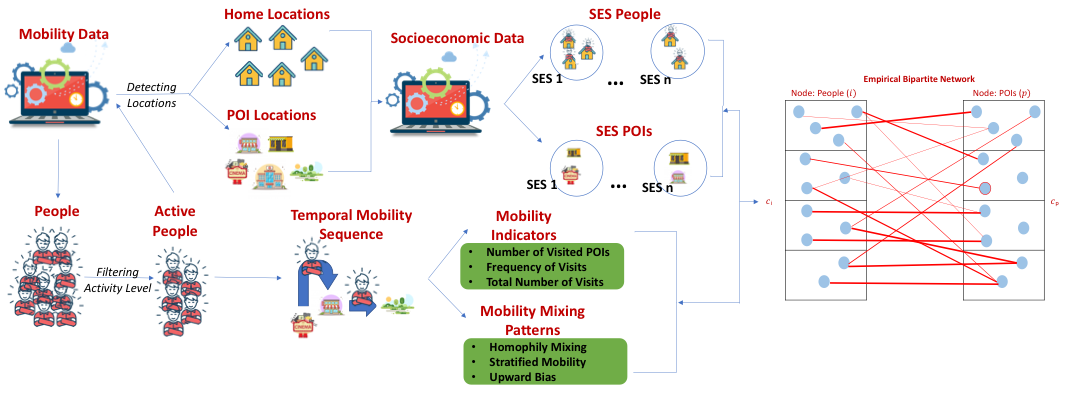
- Coupled anonymized Foursquare check-in trajectories with detailed socioeconomic data from the American Community Survey at the census tract level.
- Constructed stratification matrices to quantify the frequency of visits between individuals of different socioeconomic statuses and the places they visit.
- Calculated individual- and class-level mobility bias scores to measure the extent of upward or downward visiting preferences.
- Controlled for geographic distance by recomputing results after excluding visits to the individual’s own census tract to isolate socioeconomic effects from proximity bias.
- Used z-scores to compare individual mobility bias against a median unbiased baseline, enabling cross-city comparison of visiting patterns.
- Visualized ethnic and socioeconomic clusters to explore correlations between racial residential segregation and mobility stratification.
Experimental results
Research questions
- RQ1To what extent do individuals in U.S. metropolitan areas exhibit upward-biased mobility, visiting places in higher socioeconomic classes more than expected?
- RQ2How does the magnitude of mobility bias vary across different cities with varying levels of residential segregation?
- RQ3To what degree is mobility-based segregation correlated with racial residential segregation and other socioeconomic indicators?
- RQ4Does the exclusion of home-tract visits alter the observed patterns of mobility bias, indicating that distance alone does not explain the observed stratification?
- RQ5How do individual attributes such as race and income interact to shape mobility patterns and urban mixing dynamics?
Key findings
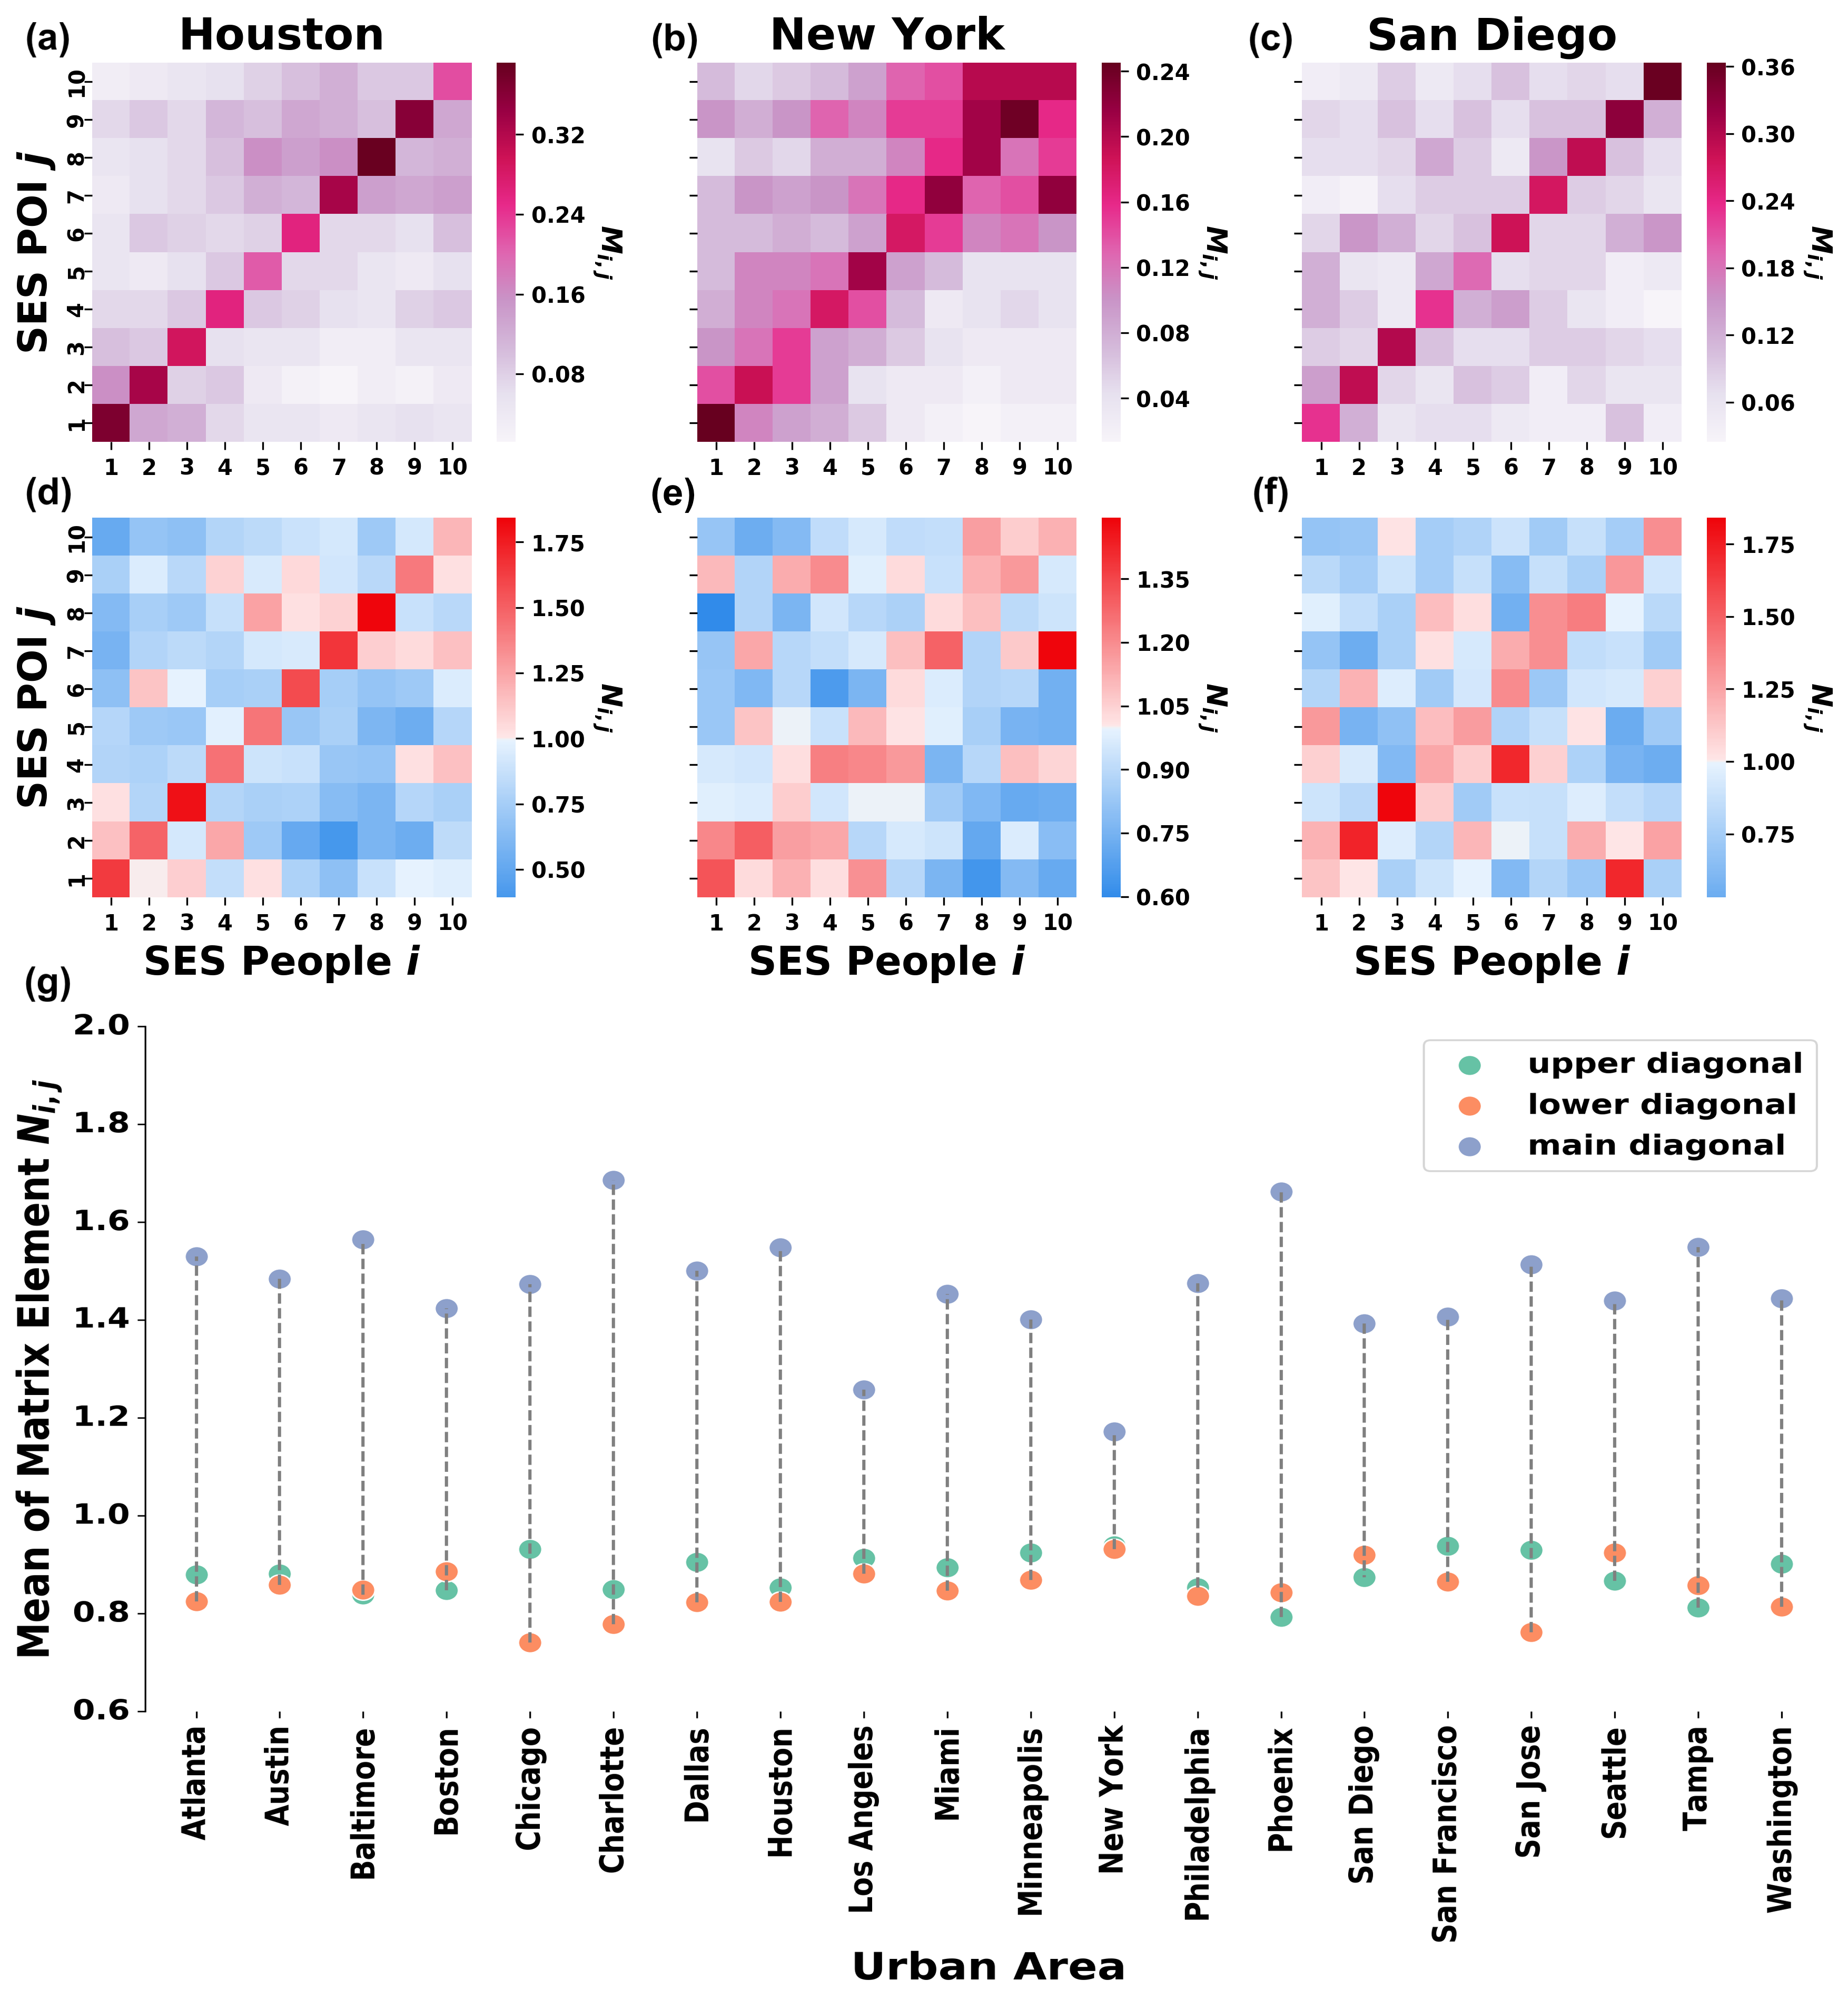
- All 20 U.S. metropolitan areas exhibit upward-biased mobility, with individuals from higher socioeconomic statuses showing a stronger tendency to visit affluent locations.
- The intensity of upward bias increases with an individual’s own socioeconomic status, indicating a gradient of access to higher-status urban venues.
- Even after excluding visits to one’s own census tract, positive z-scores for mobility bias remain consistently above the median, confirming that socioeconomic status—not just proximity—drives visiting patterns.
- Cities like Houston and San Diego show stronger stratification in mobility patterns compared to New York, where mobility is more integrated across classes.
- Visual analysis reveals that ethnic and socioeconomic clusters in mobility data closely align with patterns of residential segregation, suggesting a systemic link between residential and mobility-based inequality.
- The study finds that mobility segregation is more pronounced than what would be predicted by residential segregation alone, highlighting a dynamic dimension of urban inequality.
Better researchstarts right now
From reading papers to final review, dramatically reduce your research time.
No credit card · Free plan available
This review was created by AI and reviewed by human editors.