
[Paper Review] TwinExplainer: Explaining Predictions of an Automotive Digital Twin
TwinExplainer introduces a three-stage explainable AI framework that uses SHAP-based feature attribution to interpret predictions from a deep learning-powered automotive digital twin. By generating global and local explanations through visualizations like force plots, it enhances trust and decision-making in vehicle maintenance by revealing which sensor channels most influence normal or abnormal system behavior.
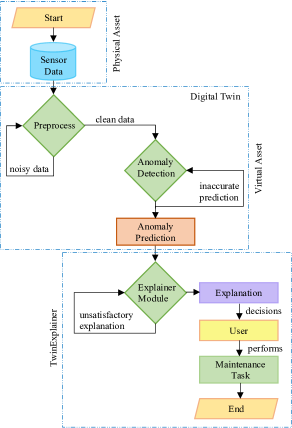
Vehicles are complex Cyber Physical Systems (CPS) that operate in a variety of environments, and the likelihood of failure of one or more subsystems, such as the engine, transmission, brakes, and fuel, can result in unscheduled downtime and incur high maintenance or repair costs. In order to prevent these issues, it is crucial to continuously monitor the health of various subsystems and identify abnormal sensor channel behavior. Data-driven Digital Twin (DT) systems are capable of such a task. Current DT technologies utilize various Deep Learning (DL) techniques that are constrained by the lack of justification or explanation for their predictions. This inability of these opaque systems can influence decision-making and raises user trust concerns. This paper presents a solution to this issue, where the TwinExplainer system, with its three-layered architectural pipeline, explains the predictions of an automotive DT. Such a system can assist automotive stakeholders in understanding the global scale of the sensor channels and how they contribute towards generic DT predictions. TwinExplainer can also visualize explanations for both normal and abnormal local predictions computed by the DT.
Motivation & Objective
- Address the lack of interpretability in deep learning-based automotive digital twins, which hinders user trust and adoption in critical maintenance applications.
- Overcome the black-box nature of state-of-the-art deep learning models used in digital twins, especially in complex cyber-physical systems like vehicles.
- Enable automotive stakeholders—mechanics, operators, and engineers—to understand *why* a digital twin predicts a sensor channel as normal or anomalous.
- Develop a systematic pipeline that integrates data processing, digital twin inference, and explanation generation for real-time vehicular diagnostics.
- Provide both global (system-wide) and local (instance-specific) explanations of model predictions using feature importance and SHAP values.
Proposed method
- Utilize a three-layered architectural pipeline: (1) data ingestion and preprocessing of time-series sensor data from the VePro dataset, (2) training a Temporal Convolutional Network (TCN) as the deep learning classifier for anomaly detection, and (3) explanation generation using SHapley Additive exPlanations (SHAP).
- Apply SHAP to compute feature attributions, quantifying the contribution of each sensor channel (e.g., engine temperature, fuel rate) to the model’s prediction output.
- Generate local explanations via force plots that visualize the positive and negative influence of each feature on a specific prediction, with color-coded arrows indicating direction and magnitude of impact.
- Create global explanations using summary plots and dependence plots to show overall feature importance and trends across the entire dataset.
- Use the base value (average prediction across the training set) as a reference point in force plots to contextualize individual predictions.
- Visualize both normal and abnormal predictions side-by-side to compare feature contributions and identify key indicators of system health.
Experimental results
Research questions
- RQ1How can the predictions of a deep learning-based automotive digital twin be made interpretable to non-technical stakeholders such as mechanics and operators?
- RQ2Which sensor channels contribute most significantly to the digital twin’s decision to classify a system state as normal or abnormal?
- RQ3Can SHAP-based feature attribution effectively explain both local (instance-specific) and global (system-wide) predictions in a vehicular digital twin?
- RQ4How do feature contributions differ between normal and abnormal system states in a real-world vehicle dataset?
- RQ5To what extent do visual explanations improve user trust and decision-making in predictive vehicle maintenance?
Key findings
- The force plot for a normal prediction (score 0.63) revealed that TrOutShaftSp, EngCoolantTemp, FuelRate, AccelPedalPos, TransOilTemp, and VehSpeedEng had the most positive influence on the prediction.
- For the same normal prediction, features like InjCtlPres, PctEngLoad, TrSelGr, TransConvLockUpEngaged, BoostPres, and IntManTemp contributed negatively to the outcome.
- In an abnormal prediction (also scored 0.63), TrOutShaftSp remained the most positively influential feature, while TransOilTemp and EngCoolantTemp emerged as the most negatively impacting features.
- The model identified InjCtlPres as the top negatively influencing feature in normal predictions, whereas TransOilTemp was the most detrimental in abnormal cases.
- The visualizations demonstrated clear differences in feature importance between normal and abnormal states, enabling stakeholders to identify critical failure indicators.
- The framework successfully generated both global and local explanations using SHAP, with force plots effectively communicating the direction and magnitude of feature effects on predictions.
Better researchstarts right now
From reading papers to final review, dramatically reduce your research time.
No credit card · Free plan available
This review was created by AI and reviewed by human editors.