
[Paper Review] Volatile-to-sulfur Ratios Can Recover a Gas Giant's Accretion History
This paper proposes that volatile-to-sulfur ratios (C/S and O/S) derived from SO₂ detections in exoplanet atmospheres can distinguish between planetesimal and pebble accretion models of gas giant formation. Using a 3D grid of photochemical models and synthetic transmission spectra for WASP-39b, it shows that SO₂ is only detectable at low C/S and O/S ratios (~≤1.5× solar), suggesting WASP-39b’s observed 1–10 ppm SO₂ is more consistent with planetesimal accretion than pebble accretion, though some pebble models also fit.
The newfound ability to detect SO2 in exoplanet atmospheres presents an opportunity to measure sulfur abundances and so directly test between competing modes of planet formation. In contrast to carbon and oxygen, whose dominant molecules are frequently observed, sulfur is much less volatile and resides almost exclusively in solid form in protoplanetary disks. This dichotomy leads different models of planet formation to predict different compositions of gas giant planets. Whereas planetesimal-based models predict roughly stellar C/S and O/S ratios, pebble accretion models more often predict superstellar ratios. To explore the detectability of SO2 in transmission spectra and its ability to diagnose planet formation, we present a grid of atmospheric photochemical models and corresponding synthetic spectra for WASP-39b (where SO2 has been detected). Our 3D grid contains 11^3 models (spanning 1--100x the solar abundance ratio of C, O, and S) for thermal profiles corresponding to the morning and evening terminators, as well as mean terminator transmission spectra. Our models show that for a WASP-39b-like O/H and C/H enhancement of ~10x Solar, SO2 can only be seen for C/S and O/S <~1.5, and that WASP-39b's reported SO2 abundance of 1--10 ppm may be more consistent with planetesimal accretion than with pebble accretion models (although some pebble models also manage to predict similarly low ratios). More extreme C/S and O/S ratios may be detectable in higher-metallicity atmospheres, suggesting that smaller and more metal-rich gas and ice giants may be particularly interesting targets for testing planet formation models. Future studies should explore the dependence of SO2 on a wider array of planetary and stellar parameters, both for the prototypical SO2 planet WASP-39b, as well as for other hot Jupiters and smaller gas giants.
Motivation & Objective
- To test whether SO₂ abundance in exoplanet atmospheres can constrain planet formation models by probing volatile-to-sulfur ratios.
- To evaluate the detectability of SO₂ in transmission spectra under varying C, O, and S abundances.
- To determine whether observed SO₂ levels in WASP-39b favor planetesimal accretion over pebble accretion models.
- To identify optimal targets for testing formation theories using SO₂ as a diagnostic.
Proposed method
- A 3D photochemical model grid was constructed with 11³ combinations of C, O, and S abundances (1–100× solar) for WASP-39b-like conditions.
- Thermal profiles for morning and evening terminators were used to compute mean terminator transmission spectra.
- The model incorporated photolysis of H₂O and H₂S to produce SO₂ via the reaction: H₂S + 2 H₂O + photon → SO₂ + 3 H₂.
- UV flux and eddy diffusion (Kzz) were varied to assess their impact on SO₂ abundance profiles.
- Synthetic spectra were generated to simulate JWST/NIRSpec and MIRI/LRS observations for detectability analysis.
- The models accounted for non-uniform SO₂ vertical profiles, avoiding assumptions of constant abundance with altitude.
Experimental results
Research questions
- RQ1Can SO₂ abundance in exoplanet atmospheres be used to infer volatile-to-sulfur ratios (C/S, O/S) and thus constrain planet formation mechanisms?
- RQ2What range of C/S and O/S ratios allows SO₂ to be detectable in transmission spectra of hot Jupiters like WASP-39b?
- RQ3Does the observed SO₂ abundance in WASP-39b (1–10 ppm) favor planetesimal accretion or pebble accretion models?
- RQ4How do variations in UV flux and vertical mixing (Kzz) affect SO₂ detectability and abundance profiles?
- RQ5Are smaller, more metal-rich gas and ice giants better targets for probing formation histories via SO₂?
Key findings
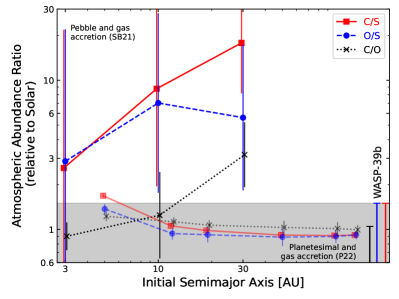
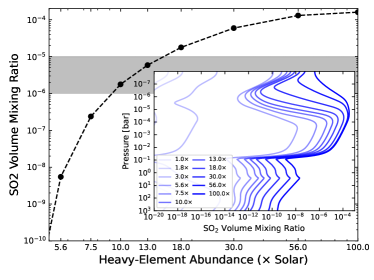
- SO₂ is only detectable in transmission spectra when C/S and O/S ratios are ≤1.5× solar, under WASP-39b-like O/H and C/H enhancements (~10× solar).
- WASP-39b’s observed SO₂ abundance of 1–10 ppm is more consistent with planetesimal accretion models than pebble accretion models, though some pebble models can also produce low ratios.
- Higher-metallicity atmospheres may allow detection of more extreme C/S and O/S ratios, making smaller, metal-rich gas and ice giants promising targets.
- UV flux variations have a minor effect on SO₂ abundance, but FUV flux can reduce SO₂ by up to 10⁴ if increased significantly.
- Assuming constant SO₂ abundance with altitude may underestimate true SO₂ levels, as profiles peak at 0.01–10 mbar, affecting retrieval accuracy.
- The sulfur-to-nitrogen ratio may also serve as a future probe of accretion mode, especially if nitrogen abundances are measurable.
Better researchstarts right now
From reading papers to final review, dramatically reduce your research time.
No credit card · Free plan available
This review was created by AI and reviewed by human editors.