[论文解读] A Cross-Domain Approach to Analyzing the Short-Run Impact of COVID-19 on the U.S. Electricity Sector
本文提出 COVID-EMDA +,一个跨域数据枢纽,将电力市场数据与 COVID-19 健康、出行与卫星数据整合,并使用 Restricted VAR 模型来量化 COVID-19 在美国产业内的短期对各市场用电的影响。
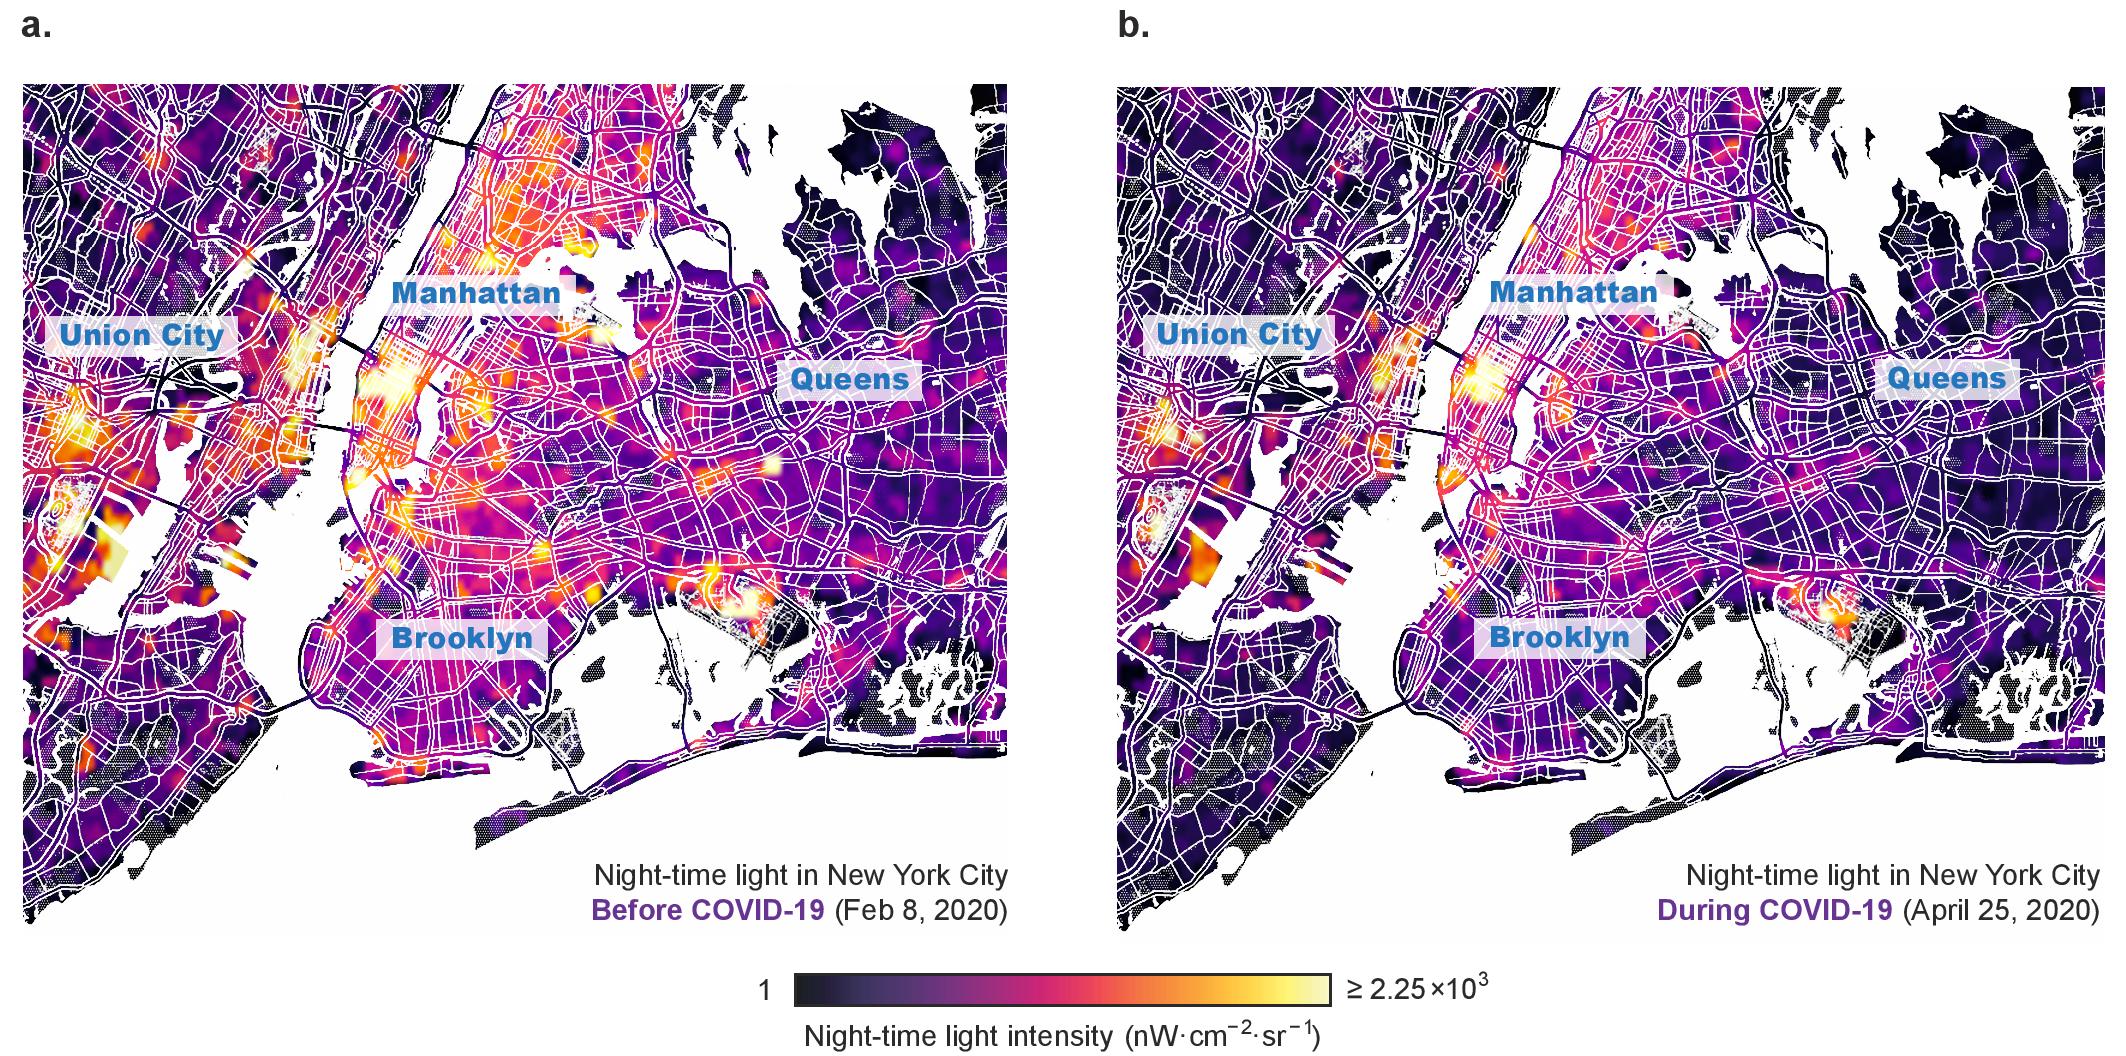
The novel coronavirus disease (COVID-19) has rapidly spread around the globe in 2020, with the U.S. becoming the epicenter of COVID-19 cases since late March. As the U.S. begins to gradually resume economic activity, it is imperative for policymakers and power system operators to take a scientific approach to understanding and predicting the impact on the electricity sector. Here, we release a first-of-its-kind cross-domain open-access data hub, integrating data from across all existing U.S. wholesale electricity markets with COVID-19 case, weather, cellular location, and satellite imaging data. Leveraging cross-domain insights from public health and mobility data, we uncover a significant reduction in electricity consumption across that is strongly correlated with the rise in the number of COVID-19 cases, degree of social distancing, and level of commercial activity.
研究动机与目标
- 动机:需要跨域分析以评估 COVID-19 对电力需求的影响。
- 创建一个开放获取的数据枢纽(COVID-EMDA +),将电力市场与健康、出行、天气和卫星数据整合。
- 开发统计框架以量化相对于跨域指标的用电变化。
- 量化区域级和城市级的负荷下降,并识别驱动因素。
提出的方法
- 构建一个开放获取的数据枢纽 COVID-EMDA +,聚合电力市场、天气、COVID-19 病例数据、出行数据(SafeGraph)和卫星图像数据。
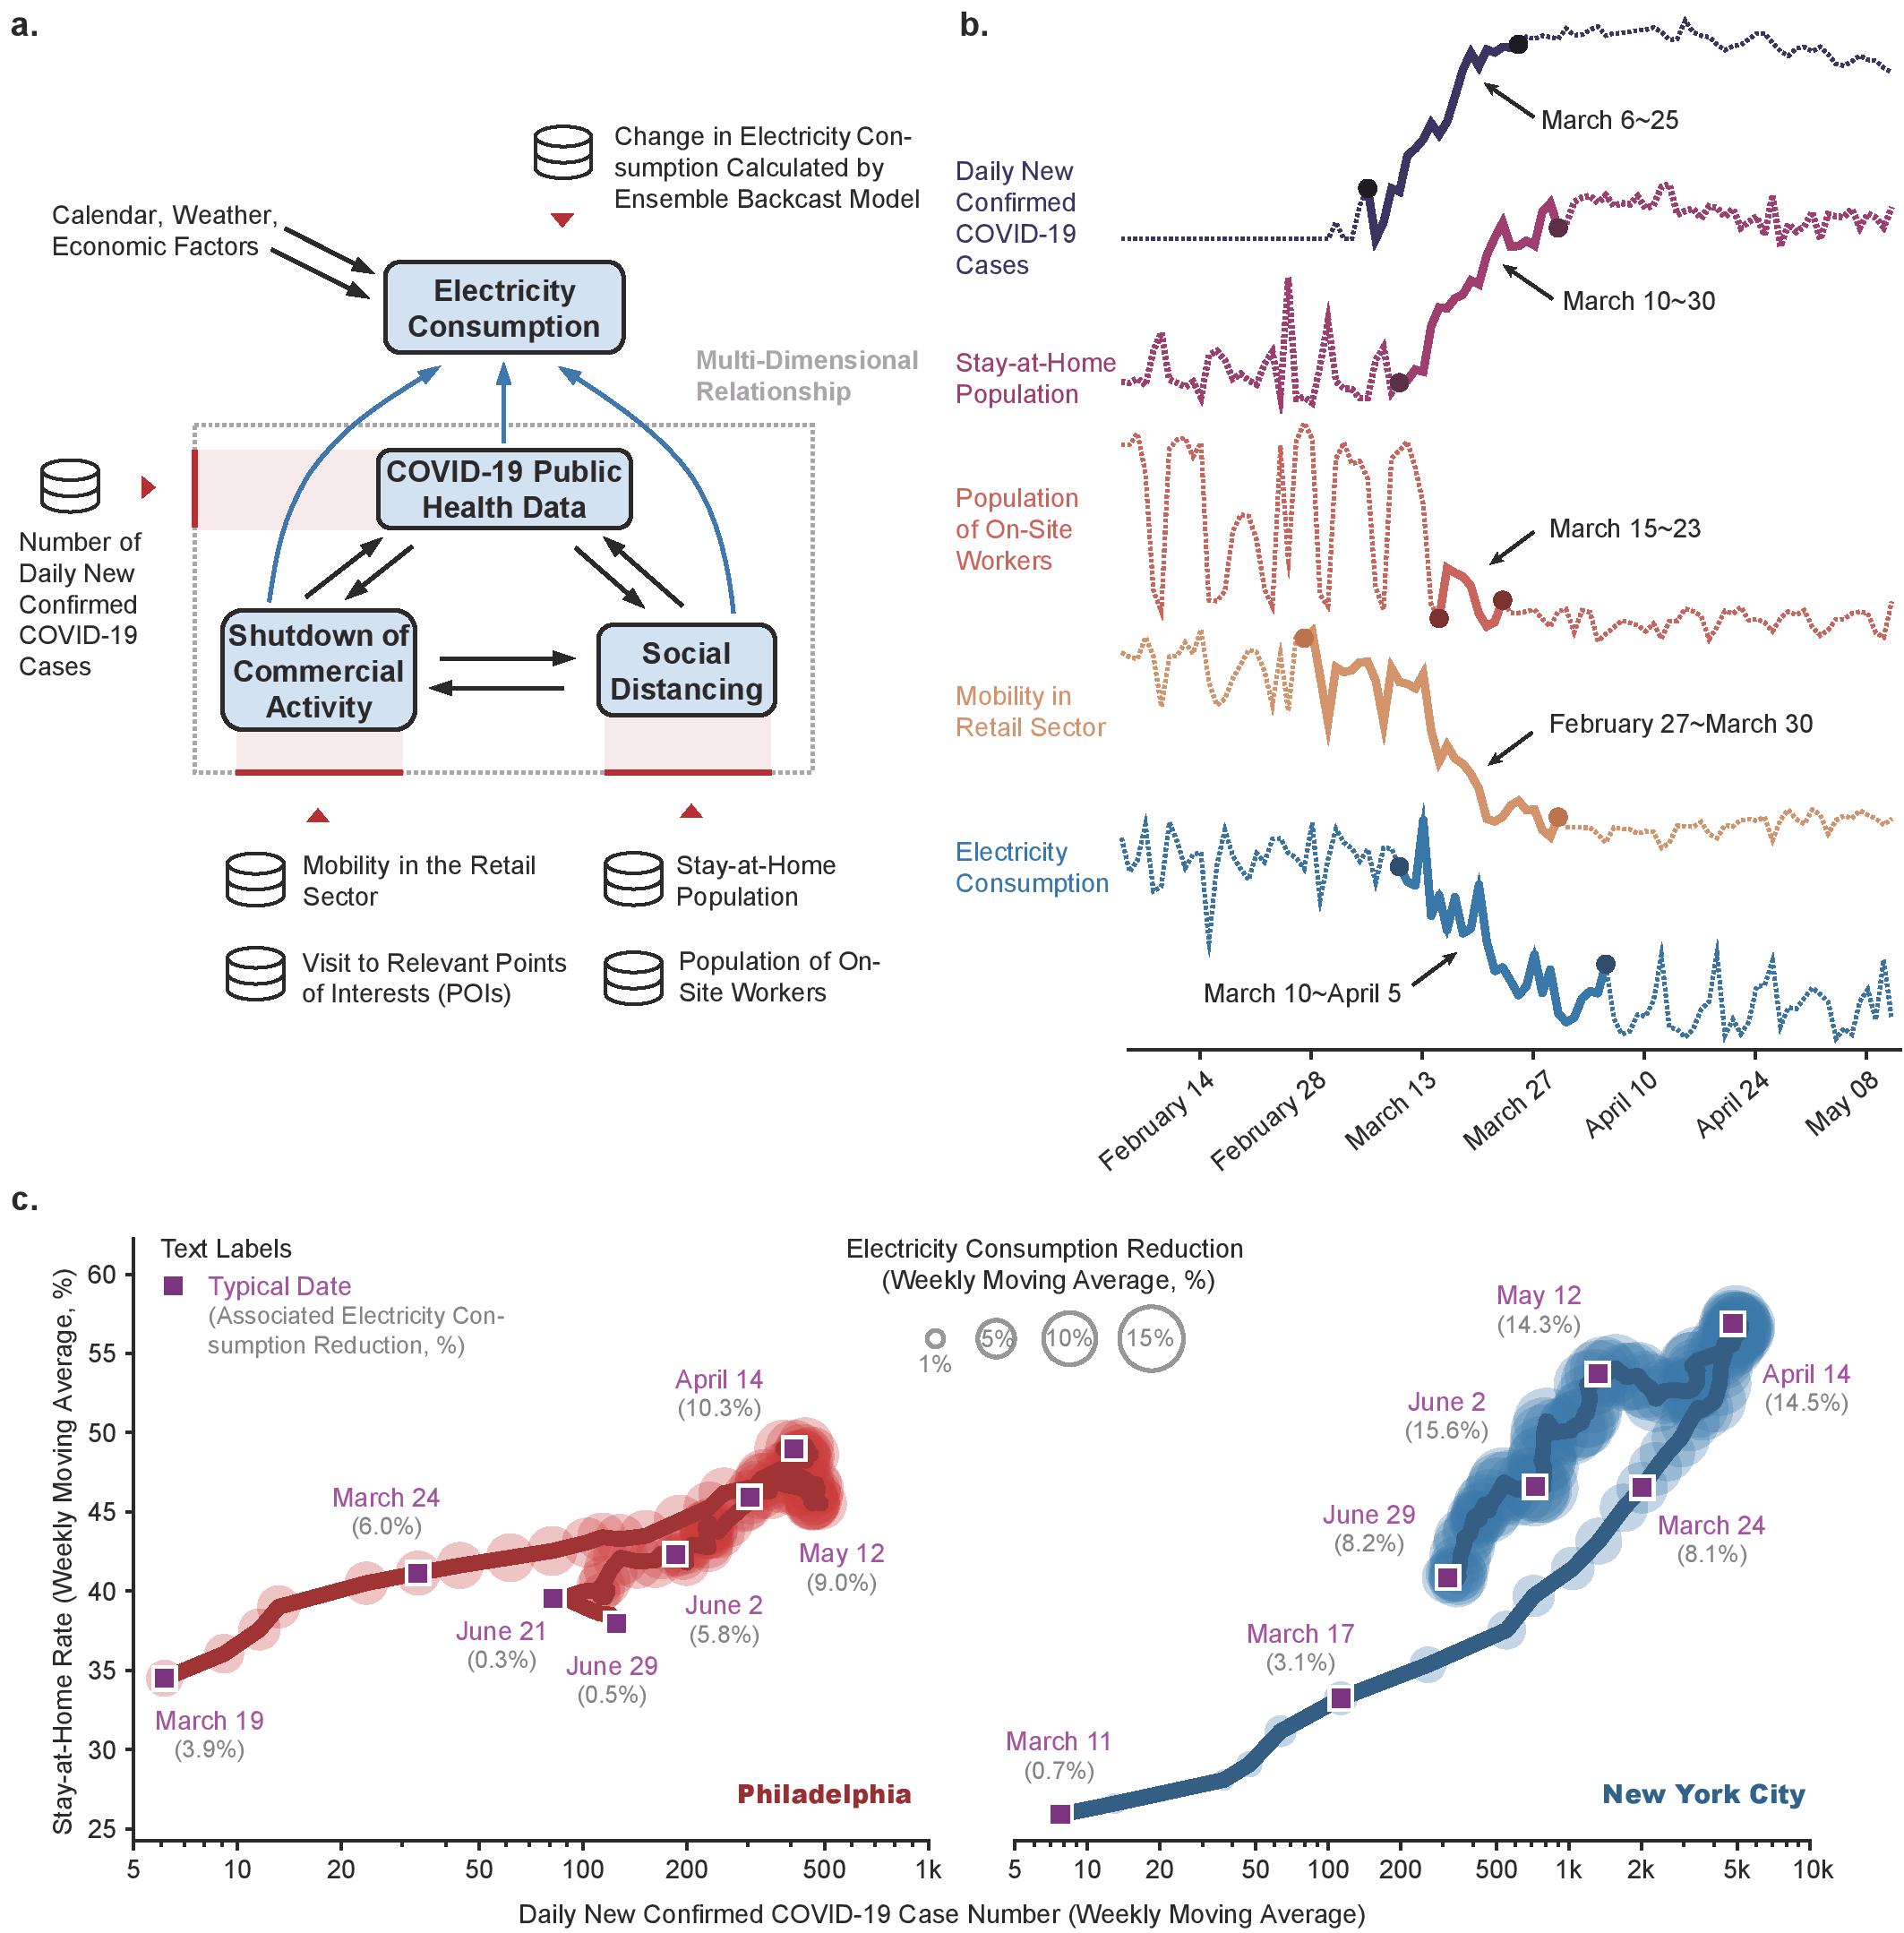
- 开发一个集合回溯(backcast)模型,在考虑天气、日历和 GDP 增长因素的情况下估计 COVID 之前的用电量。
- 对城市级受限向量自回归(Restricted Vector Autoregression, VAR)模型进行标定,以分析多因素对用电量的影响,并执行方差分解和冲击响应分析。
- 使用地理编码和数据统一化将异质数据源对齐到共同的时空分辨率。
- 评估 2020 年 4–6 月的跨市场和跨城市用电量下降,并将其与跨域因素联系起来。
实验结果
研究问题
- RQ1COVID-19、社交距离和零售出行与美国各市场和城市用电量的变化之间存在怎样的关系?
- RQ2公共卫生指标、社交距离指标和商业活动在解释负荷下降方面相对重要性如何?
- RQ3跨因素的动态时间尺度差异(自上而下与自下而上响应)是否会对用电量产生滞后效应?
- RQ4跨域数据能否在疫情期间改进短期负荷预测和政策评估?
主要发现
| 市场/城市 | 二月 | 三月 | 四月 | 五月 | 六月 |
|---|---|---|---|---|---|
| CAISO | -1.31 | 2.68 | 9.24 | 6.46 | 0.29 |
| MISO | -0.14 | 1.77 | 10.24 | 10.71 | 3.49 |
| ISO-NE | 2.15 | 5.24 | 9.47 | 10.44 | 1.79 |
| NYISO | 0.84 | 4.51 | 10.20 | 10.47 | 5.72 |
| PJM | 0.54 | 2.68 | 9.44 | 7.35 | 0.14 |
| SPP | -0.90 | 2.47 | 7.72 | 9.24 | 2.66 |
| ERCOT | -1.52 | 1.30 | 6.36 | 4.44 | 2.41 |
| Boston | 0.40 | 7.12 | 11.32 | 9.36 | 0.41 |
| Chicago | 0.09 | 2.95 | 9.81 | 9.51 | 3.24 |
| Houston | -0.55 | -0.53 | 5.33 | 3.63 | 4.41 |
| Kansas City | 0.10 | 0.24 | 9.04 | 7.01 | 0.21 |
| Los Angeles | -1.12 | 3.32 | 11.06 | 3.91 | -1.90 |
| New York City | 0.43 | 5.27 | 14.10 | 14.77 | 11.07 |
| Philadelphia | 0.75 | 3.94 | 8.93 | 8.24 | 2.07 |
- 所有美国电力市场在 2020 年 4 月和 5 月均出现下降,幅度介于 6.36% 到 10.24%(4 月)和 4.44% 到 10.71%(5 月)。
- New York ISO (NYISO) 和 MISO 出现了最大的下降,而 ERCOT 和 SPP 的下降较小。
- 零售出行(商业活动)是影响各城市负荷下降最显著、最稳健的因素,在不同市场中具有量化的敏感性(例如休斯敦:1% 零售出行下降 ≈ 0.78% 稳态负荷下降)。
- 新冠病例数对冲击响应中的消费直接影响较弱,表明存在通过社交距离和商业活动的间接效应。
- 城市层面分析显示,密集城市区域(如纽约市、波士顿)比分散区域(如休斯敦)遭受的下降更大。
- 跨域洞见揭示了异质、区域特定的动态,以及在制定政策和运营决策时需要进行区域定位的分析。
更好的研究,从现在开始
从论文设计到论文写作,大幅缩短您的研究时间。
无需绑定信用卡
本解读由 AI 生成,并经人工编辑审核。