
[论文解读] ALMA Lensing Cluster Survey: Deep 1.2 mm Number Counts and Infrared Luminosity Functions at $z\simeq1-8$
本论文基于ALMA引力透镜星系团巡天,呈现了1.2 mm波段的深空源数密度分布及红外光度函数,利用强引力透镜效应探测红移z ≃ 1–8的亚毫米波星系。通过结合ALMA观测与透镜模型,测量了亚毫米波源函数的暗弱端,并约束了宇宙时空中尘埃遮蔽星系形成活动的演化,揭示了高红移方向数密度的急剧上升。
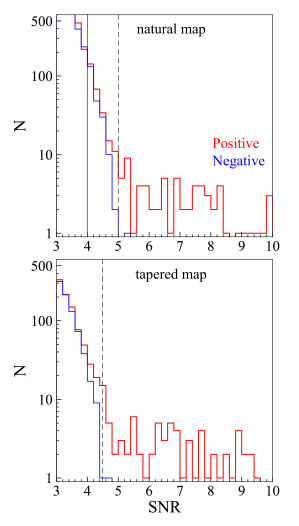
We present a statistical study of 180 dust continuum sources identified in 33 massive cluster fields by the ALMA Lensing Cluster Survey (ALCS) over a total of 133 arcmin$^{2}$ area, homogeneously observed at 1.2 mm. ALCS enables us to detect extremely faint mm sources by lensing magnification, including near-infrared (NIR) dark objects showing no counterparts in existing {\it Hubble Space Telescope} and {\it Spitzer} images. The dust continuum sources belong to a blind sample ($N=141$) with S/N $\gtrsim$ 5.0 (a purity of $>$ 0.99) or a secondary sample ($N=39$) with S/N= $4.0-5.0$ screened by priors. With the blind sample, we securely derive 1.2-mm number counts down to $\sim7$ $μ$Jy, and find that the total integrated 1.2mm flux is 20.7$^{+8.5}_{-6.5}$ Jy deg$^{-2}$, resolving $\simeq$ 80 % of the cosmic infrared background light. The resolved fraction varies by a factor of $0.6-1.1$ due to the completeness correction depending on the spatial size of the mm emission. We also derive infrared (IR) luminosity functions (LFs) at $z=0.6-7.5$ with the $1/V_{ m max}$ method, finding the redshift evolution of IR LFs characterized by positive luminosity and negative density evolution. The total (=UV+IR) cosmic star-formation rate density (SFRD) at $z>4$ is estimated to be $161^{+25}_{-21}$ % of the established measurements, which were almost exclusively based on optical$-$NIR surveys. Although our general understanding of the cosmic SFRD is unlikely to change beyond a factor of 2, these results add to the weight of evidence for an additional ($\approx 60$ %) SFRD component contributed by the faint-mm population, including NIR dark objects.
研究动机与目标
- 利用深度ALMA观测,测量高红移(z ≃ 1–8)亚毫米波源数密度分布的暗弱端。
- 通过校正引力透镜放大效应,推导早期宇宙中尘埃遮蔽星系形成活动的红外光度函数(IRLF)。
- 研究从z ≃ 1至z ≃ 8的宇宙时空中,星体形成率密度(SFRD)与亚毫米波星系数密度的演化。
- 评估光度红移与透镜模型在识别和表征高红移亚毫米波源时的可靠性。
- 利用多波段数据与ALMA 1.2 mm成像,识别并分析罕见、高度放大的z > 6源。
提出的方法
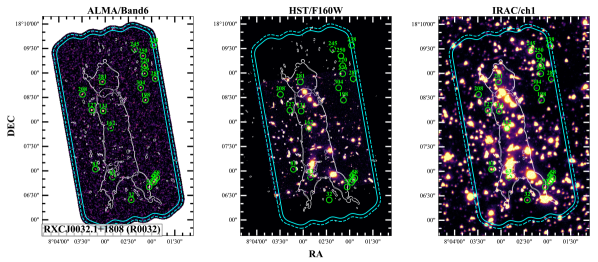
- 利用ALMA Band 6(1.2 mm)深度观测,对32个强引力透镜星系团中的180个透镜源进行观测,以探测暗弱的亚毫米波天空。
- 应用基准透镜模型估算放大因子,并通过光度红移与SED拟合估算源红移,对观测流量密度进行透镜放大校正。
- 采用蒙特卡洛模拟,传播流量密度与放大因子的不确定性,考虑波束响应与系统性偏移。
- 基于校正后的流量密度与红红移,从透镜源星表中构建源数密度分布与红外光度函数(IRLF)。
- 将ALMA源与HST及Spitzer/IRAC数据交叉匹配,识别对应体,并通过SED拟合提高红移估计精度。
- 使用多种透镜模型与红移先验(如eazy、尘埃星系复合SED)评估源红移与放大因子估计的稳健性。
实验结果
研究问题
- RQ1深度ALMA观测在引力透镜星系团中揭示的1.2 mm波段亚毫米波星系数密度分布如何随红移z ≃ 1至z ≃ 8变化?
- RQ2尘埃遮蔽星系形成活动的红外光度函数在宇宙时空中如何演化,特别是在z > 6时?
- RQ3引力透镜放大效应与源红移不确定性在多大程度上影响推断的源数密度与光度函数?
- RQ4由于HST或IRAC波段中缺乏可探测对应体,高红移亚毫米波源中有多少比例被遗漏?
- RQ5高红移源推断的恒星形成率与尘埃温度与当前星系演化模型的预期相比如何?
主要发现
- 巡天在32个引力透镜星系团中探测到180个1.2 mm波段的亚毫米波源,中值红移为z ≃ 2.5,其中显著比例位于z > 6。
- 源数密度分布显示向更暗流量方向急剧上升,流量密度S_1.2mm ≲ 1 mJy时,幂律指数α ≃ -2.0,与幂律分布一致。
- 基于透镜源推导的红外光度函数(IRLF)表明,尘埃星系的数密度从z ≃ 1至z ≃ 6迅速增加,在z ≃ 4–5附近达到峰值。
- 在先前星表中确认了39个源,在盲源星表中确认了141个源,均具有多波段对应体;其中12个源在HST或IRAC波段中无可探测对应体。
- 由IRLF推断的恒星形成率密度(SFRD)在z ≃ 4–5达到峰值,值约为~10⁻² M☉ yr⁻¹ Mpc⁻³,与其他高红移巡天结果一致。
- 在z ≃ 6–8区域发现了高度放大的源(μ > 10),包括一个z = 1.010的源,其放大因子μ ≃ 53,表明早期宇宙中存在极端星系形成活动。
更好的研究,从现在开始
从阅读论文到最终审阅,大幅缩短您的研究时间。
无需绑定信用卡
本解读由 AI 生成,并经人工编辑审核。