
[Paper Review] Counting Carbon: A Survey of Factors Influencing the Emissions of Machine Learning
The paper surveys carbon emissions from ML model training across 95 models, analyzes energy sources, emissions, their evolution over time, and relation to performance, and proposes centralized reporting.
Machine learning (ML) requires using energy to carry out computations during the model training process. The generation of this energy comes with an environmental cost in terms of greenhouse gas emissions, depending on quantity used and the energy source. Existing research on the environmental impacts of ML has been limited to analyses covering a small number of models and does not adequately represent the diversity of ML models and tasks. In the current study, we present a survey of the carbon emissions of 95 ML models across time and different tasks in natural language processing and computer vision. We analyze them in terms of the energy sources used, the amount of CO2 emissions produced, how these emissions evolve across time and how they relate to model performance. We conclude with a discussion regarding the carbon footprint of our field and propose the creation of a centralized repository for reporting and tracking these emissions.
Motivation & Objective
- Quantify the carbon emissions associated with ML model training across diverse tasks and time periods.
- Identify the main factors driving emissions (energy source, training time, hardware) and quantify their impact.
- Examine how emissions have evolved over time and across tasks.
- Explore the relationship between energy/CO2 use and model performance to assess efficiency gains.
Proposed method
- Leverage Thompson et al. (2020) dataset of ML computational requirements and sample 500 papers, obtaining 95 trained models from 77 papers (15.4% response rate).
- Estimate CO2eq emissions using C = P × T × I = E × I, where P is hardware power (via TDP), T is training time in GPU hours, and I is grid carbon intensity from public sources.
- Estimate carbon intensity by training location, using yearly grid data; account for internal company infrastructures via company reports; for cloud platforms, use provider data.
- Compute training time as total hardware hours (e.g., 16 GPUs for 24 hours = 384 GPU hours).
- Present results with log-scaled energy and emissions; analyze main energy sources (coal, natural gas, hydro, oil, nuclear) and their corresponding carbon intensities; examine relationships between energy, emissions, and performance.
Experimental results
Research questions
- RQ1What are the main sources of energy used for training ML models?
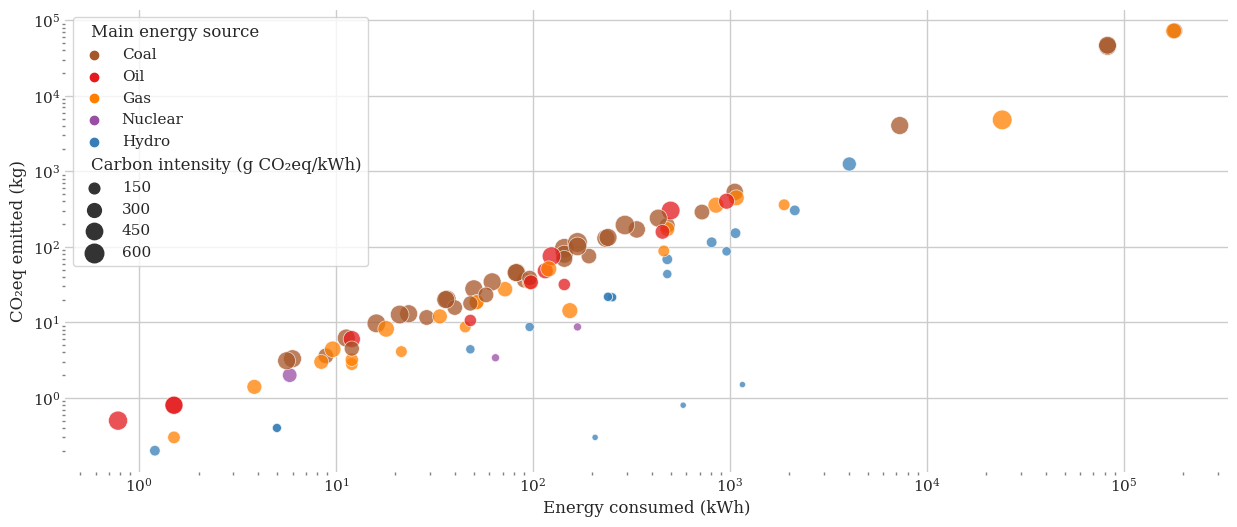
- RQ2What is the order of magnitude of CO2 emissions produced by training ML models?
- RQ3How do the CO2 emissions produced by training ML models evolve over time?
- RQ4Does more energy and CO2 lead to better model performance?
Key findings
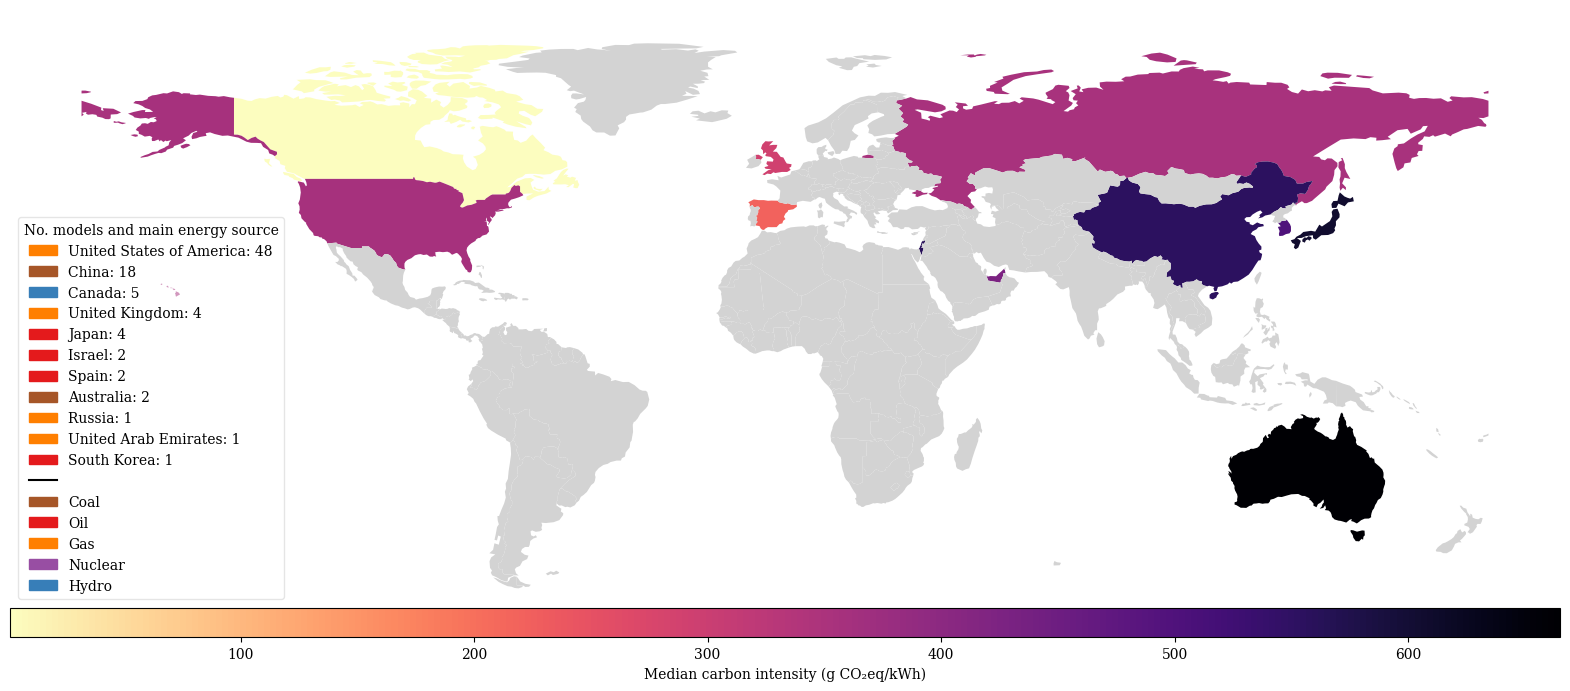
- Most models (61) used high-carbon energy sources (coal or natural gas) with average carbon intensities around 350–512 gCO2e/kWh; 34 used low-carbon sources (hydroelectric or nuclear).
- Average carbon intensity across the sample is about 372 gCO2e/kWh, lower than global average but still substantial room for improvement.
- Total emissions for the analyzed models are about 253 tons CO2e, with emissions rising over time (roughly a 100x increase from 2012 to recent years).
- Emissions vary largely with training time and energy source; hardware power (TDP 180–300 W) explains less variation compared to energy source and duration.
- There is not a strong, consistent link between higher energy use and better performance across most tasks; notable exception is ImageNet where higher emissions roughly align with higher accuracy, but the relationship is not universal.
Better researchstarts right now
From reading papers to final review, dramatically reduce your research time.
No credit card · Free plan available
This review was created by AI and reviewed by human editors.