
[论文解读] Graph Representation of the Magnetic Field Topology in High-Fidelity Plasma Simulations for Machine Learning Applications
本文提出了一种可扩展的流程,用于对高保真度等离子体模拟中的三维磁向量场进行拓扑数据分析,利用空间和时空零点图来表示磁场所拓扑结构。该方法通过将复杂的磁重连动力学转化为结构化的图输入,使机器学习应用(尤其是图神经网络)成为可能,其在地球磁尾的 Vlasiator 模拟中已得到验证。
Topological analysis of the magnetic field in simulated plasmas allows the study of various physical phenomena in a wide range of settings. One such application is magnetic reconnection, a phenomenon related to the dynamics of the magnetic field topology, which is difficult to detect and characterize in three dimensions. We propose a scalable pipeline for topological data analysis and spatiotemporal graph representation of three-dimensional magnetic vector fields. We demonstrate our methods on simulations of the Earth's magnetosphere produced by Vlasiator, a supercomputer-scale Vlasov theory-based simulation for near-Earth space. The purpose of this work is to challenge the machine learning community to explore graph-based machine learning approaches to address a largely open scientific problem with wide-ranging potential impact.
研究动机与目标
- 为解决在等离子体物理中复杂且理解不足的三维磁重连现象的检测与表征挑战。
- 开发一种可扩展、自动化的流程,用于从高保真度三维磁向量场中提取拓扑特征——特别是磁零点。
- 通过将磁场所拓扑结构转化为空间和时空图表示,使机器学习应用成为可能,用于图神经网络。
- 提供一种数据驱动且可解释的框架,用于研究地球磁层乃至更广泛范围内的磁重连和等离子体片形成过程。
- 向机器学习社区发起挑战,探索基于图的方法,以解决在空间天气方面具有广泛影响的等离子体物理中的开放性问题。
提出的方法
- 该方法使用可视化工具包(VTK)并扩展了向量场拓扑过滤器,以在 Vlasiator 模拟的三维向量场中检测和分类磁零点。
- 通过将磁零点表示为节点、其拓扑连接(如分隔线、分隔面)表示为边,构建空间零点图,边的颜色编码连接类型。
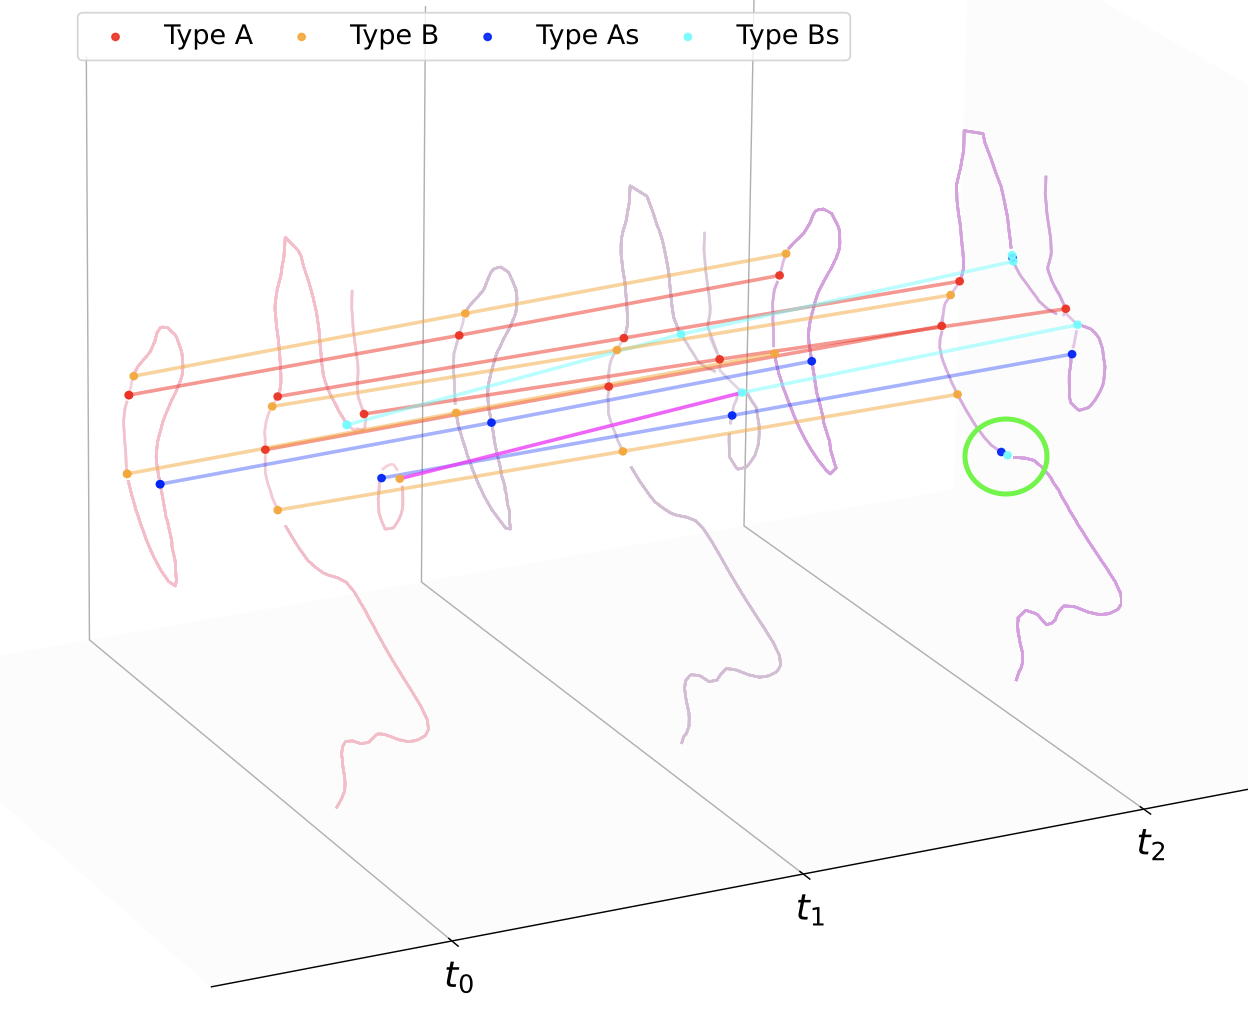
- 通过追踪连续时间步长中正常零点的演化,形成时空零点图,时间边连接同一零点在连续时间步长中的表示。
- 基于磁场所雅可比矩阵的特征值对零点类型进行分类,识别出四种不同的拓扑类型。
- 该流程通过仅关注拓扑特征,将大规模数据(如约 2.93 亿个网格点)的维度降低,同时保持物理相关性。
- 生成的图被设计为图神经网络的输入,支持在磁重连检测和等离子体片预测中进行空间和时间学习任务。

实验结果
研究问题
- RQ1如何系统地表示高保真度等离子体模拟中三维磁场所拓扑结构,以支持机器学习?
- RQ2在三维磁重连中,关键的拓扑特征——特别是磁零点及其连接——是什么?
- RQ3如何对磁零点的时序演化进行建模,以捕捉动态磁重连过程?
- RQ4基于磁零点的时空图表示能否提升对磁尾中等离子体片形成的检测与预测能力?
- RQ5基于此类拓扑图训练的图基机器学习模型,在识别重连位点方面,与传统方法相比能有多大程度的性能提升?
主要发现
- 该流程成功地在 Vlasiator 模拟的地球磁尾三维磁向量场中检测并分类了二维和正常磁零点。
- 构建了空间零点图,将零点作为节点,拓扑连接作为边,不同颜色编码不同的空间连接类型。
- 生成了时空零点图,时间边追踪了零点在每秒时间步长中的演化,揭示了如零点分叉和类型切换等动态过程。
- 一对极性相反的零点在分叉事件后共同形成,时空图中以绿色圆圈标记,表明其可能是磁重连的前兆。
- 该方法可扩展至大规模数据集,通过仅关注拓扑特征而非完整向量场数据,处理高达约 2.93 亿个网格点的模拟。
- 生成的图提供了结构化且可解释的图神经网络输入,使在复杂等离子体环境中检测磁重连和等离子体片形成成为可能。
更好的研究,从现在开始
从阅读论文到最终审阅,大幅缩短您的研究时间。
无需绑定信用卡
本解读由 AI 生成,并经人工编辑审核。