
[论文解读] Inferences on Mixing Probabilities and Ranking in Mixed-Membership Models
本文为度数校正混合成员(DCMM)模型中的混合概率提出了一种新颖的有限样本展开式,实现了节点成员身份分布的渐近推断与置信区间构建。提出了一种基于乘子自展法的排名推断框架,以统计方式评估基于社区成员身份的节点排名,并通过合成网络与真实网络数据验证了其有效性。
Network data is prevalent in numerous big data applications including economics and health networks where it is of prime importance to understand the latent structure of network. In this paper, we model the network using the Degree-Corrected Mixed Membership (DCMM) model. In DCMM model, for each node $i$, there exists a membership vector $\boldsymbolπ_ i = (\boldsymbolπ_i(1), \boldsymbolπ_i(2),\ldots, \boldsymbolπ_i(K))$, where $\boldsymbolπ_i(k)$ denotes the weight that node $i$ puts in community $k$. We derive novel finite-sample expansion for the $\boldsymbolπ_i(k)$s which allows us to obtain asymptotic distributions and confidence interval of the membership mixing probabilities and other related population quantities. This fills an important gap on uncertainty quantification on the membership profile. We further develop a ranking scheme of the vertices based on the membership mixing probabilities on certain communities and perform relevant statistical inferences. A multiplier bootstrap method is proposed for ranking inference of individual member's profile with respect to a given community. The validity of our theoretical results is further demonstrated by via numerical experiments in both real and synthetic data examples.
研究动机与目标
- 填补混合成员网络模型中节点混合概率不确定性量化方面的关键空白。
- 构建一个统计框架,基于节点在特定社区中的成员身份分布对节点进行排名。
- 实现对节点相对排名的有效推断,例如判断某一节点在特定社区中是否比另一节点更具代表性。
- 通过有限样本展开式,为成员比例的置信区间与假设检验提供理论保证。
- 将现有的谱聚类与扰动理论扩展至支持 $ l_{\infty} $ 与 $ l_{2,\infty} $ 样式的误差界,以支持推断。
提出的方法
- 利用子空间扰动理论,推导出个体 $ \boldsymbol{\pi}_i(k) $(即节点 $ i $ 在社区 $ k $ 中的混合概率)的新型有限样本展开式。
- 利用谱聚类估计成员身份分布,并构造具有受控 $ l_{\infty} $ 与 $ l_{2,\infty} $ 误差界的估计量。
- 提出一种乘子自展方法,以近似排名统计量的抽样分布,从而实现对节点排名的有效推断。
- 使用基于迹的检验统计量 $ \mathcal{T} = \max_{j \neq i} \left| \frac{\text{Tr}[(\boldsymbol{C}^{\boldsymbol{\pi}}_{j,k} - \boldsymbol{C}^{\boldsymbol{\pi}}_{i,k}) \boldsymbol{W}]}{\sqrt{V_{\boldsymbol{C}^{\boldsymbol{\pi}}_{j,k} - \boldsymbol{C}^{\boldsymbol{\pi}}_{i,k}}}} \right| $ 进行排名推断。
- 在 $ \varepsilon_3 $ 与 $ \|\boldsymbol{C}^{\boldsymbol{\pi}}_{j,k} - \boldsymbol{C}^{\boldsymbol{\pi}}_{i,k}\|_{\text{max}} $ 的条件下,通过浓度不等式与高斯混沌比较,建立自展法的渐近有效性。
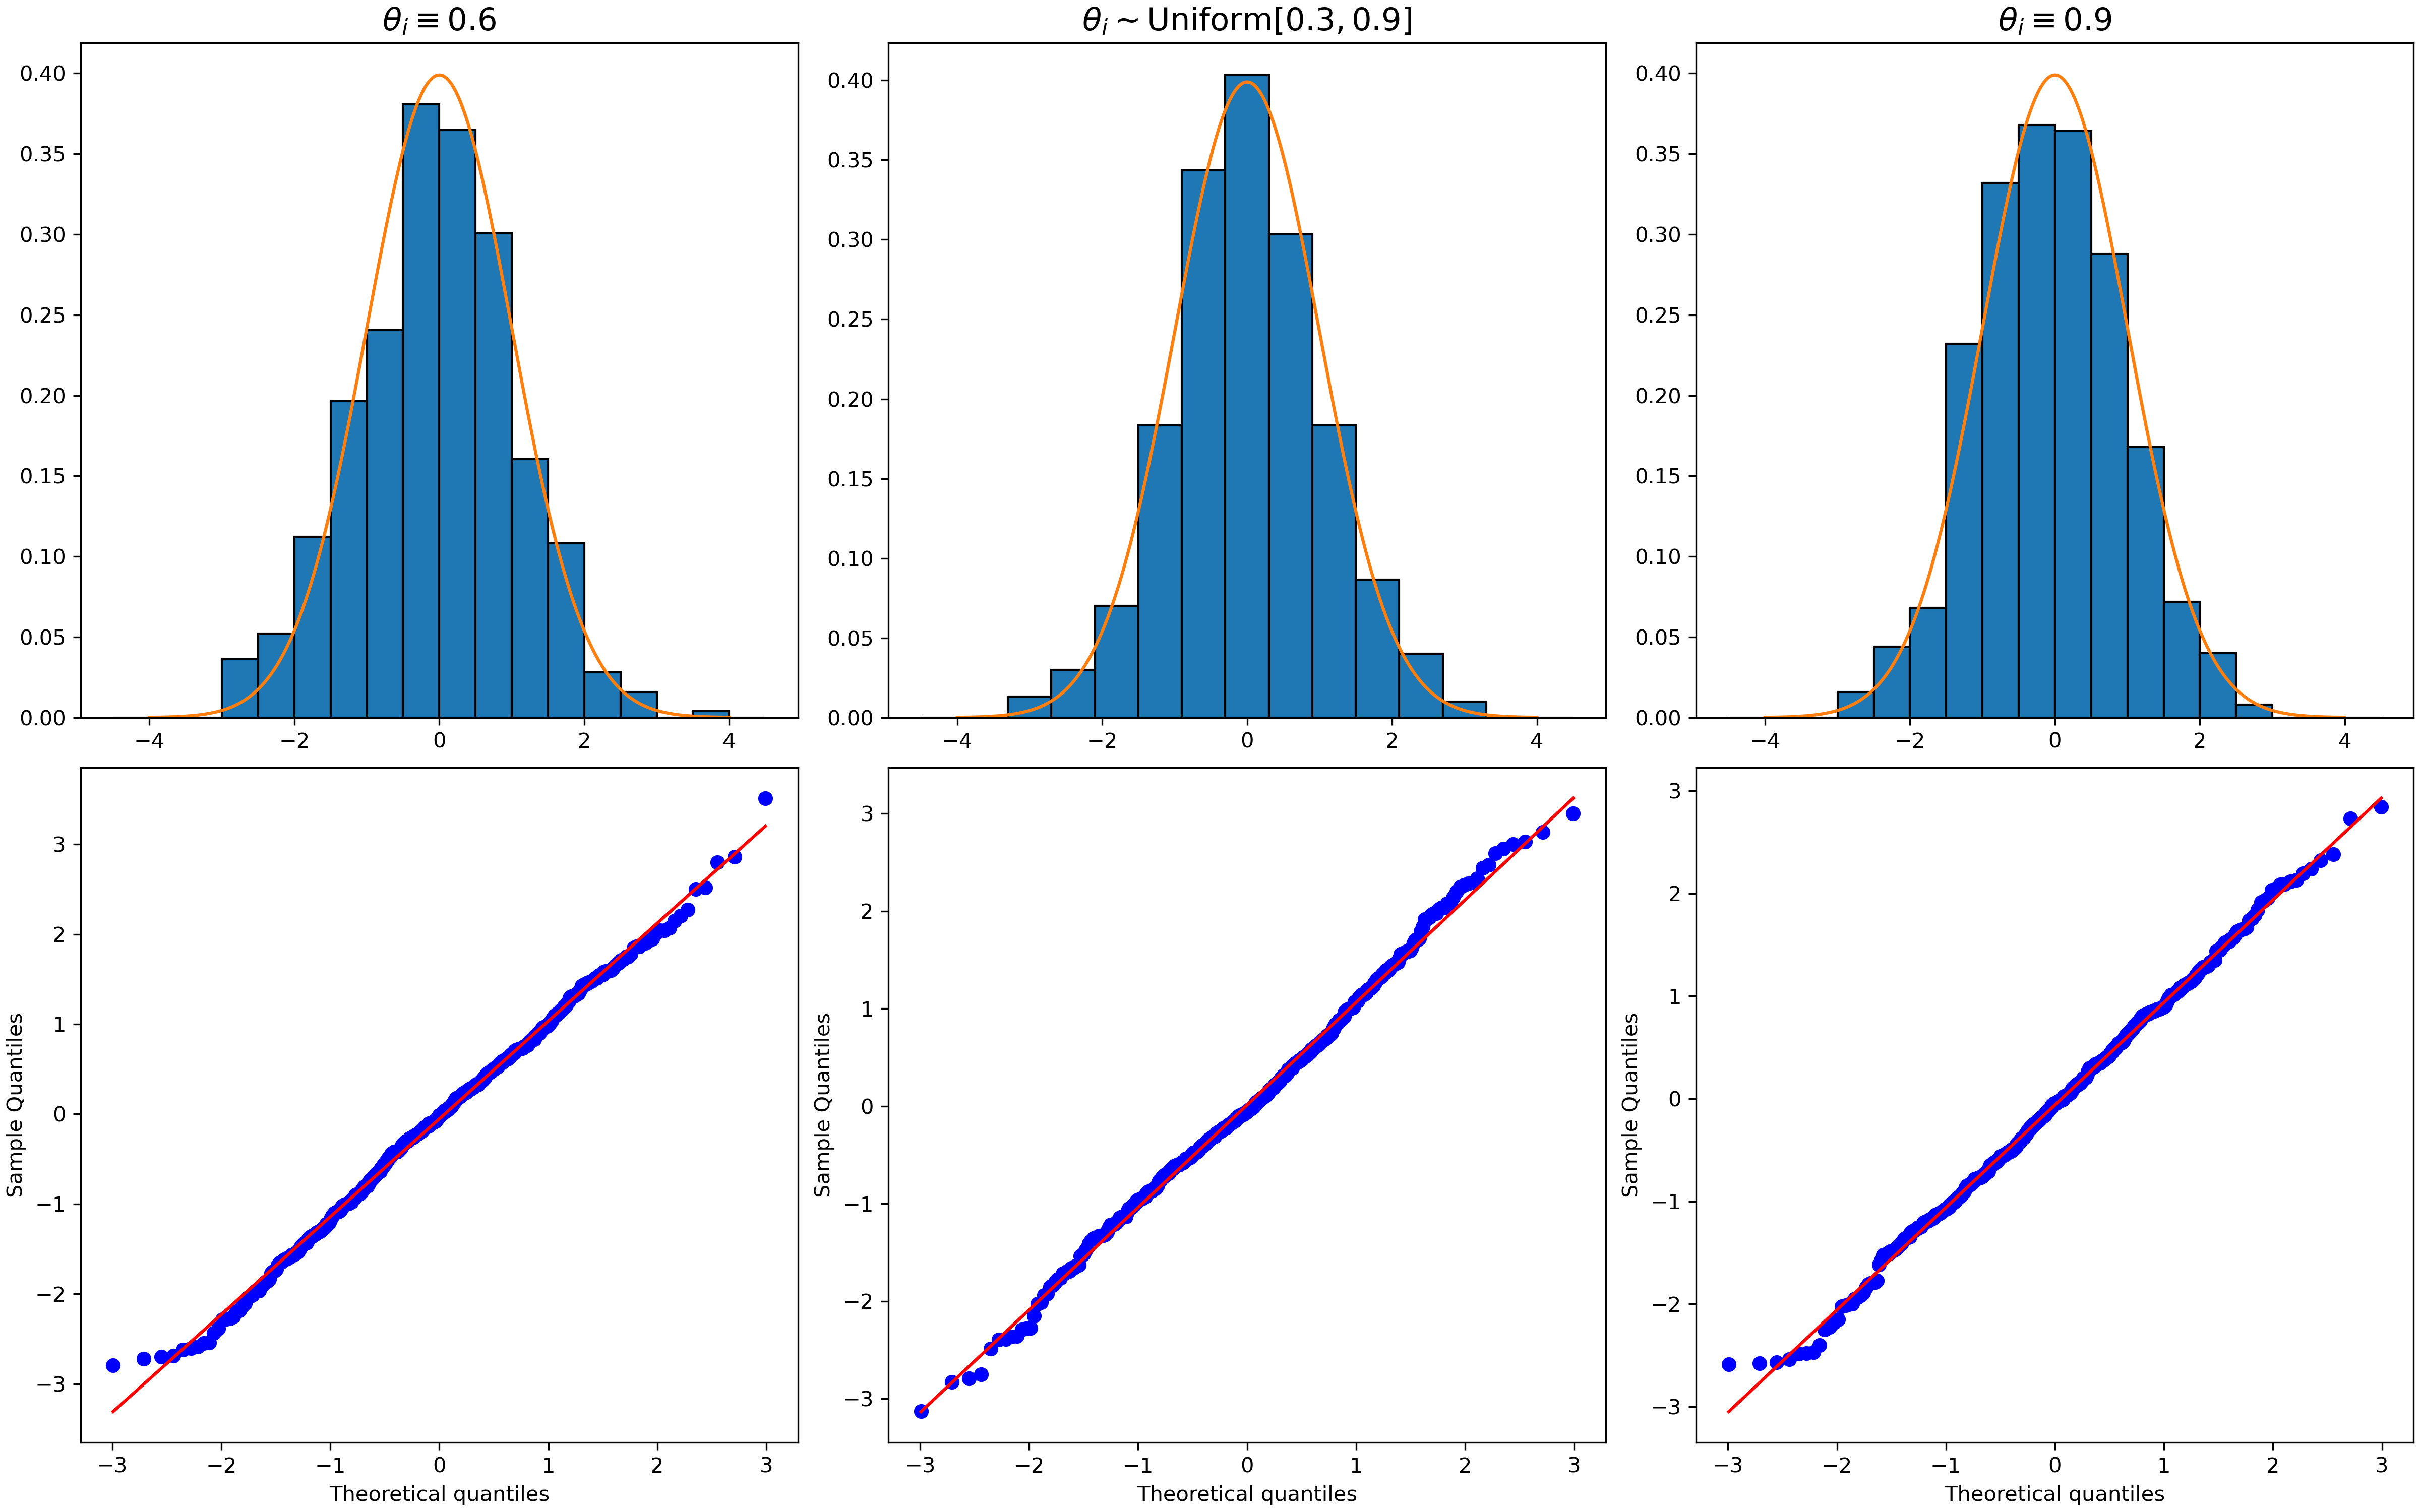
- 通过在合成网络与真实网络数据上的数值实验验证理论结果,表明置信区间覆盖准确,排名推断可靠。
实验结果
研究问题
- RQ1我们能否利用有限样本展开式,为DCMM模型中的节点混合概率 $ \boldsymbol{\pi}_i(k) $ 提供有效的置信区间?
- RQ2如何基于节点在特定社区中的成员身份,对节点的相对排名进行统计推断?
- RQ3用于比较两个节点在给定社区中成员身份分布的检验统计量的渐近分布是什么?
- RQ4所提出的乘子自展方法在DCMM模型下是否能产生有效的临界值用于排名推断?
- RQ5为保证推断框架的渐近有效性,网络结构与估计误差的充分条件是什么?
主要发现
- 本文建立了 $ \boldsymbol{\pi}_i(k) $ 的有限样本展开式,实现了个体混合概率的渐近正态性与置信区间构建。
- 所提出的乘子自展方法在排名推断中实现了渐近有效性,满足 $ \left| \mathbb{P}(\mathcal{T} > c_{1-\alpha}) - \alpha \right| \to 0 $,在正则条件下成立。
- 理论保证在涉及 $ \varepsilon_3 $、$ \|\boldsymbol{C}^{\boldsymbol{\pi}}_{j,k} - \boldsymbol{C}^{\boldsymbol{\pi}}_{i,k}\|_{\text{max}} $ 与 $ \log n $ 缩放误差项的条件下成立。
- 在合成网络与真实网络上的数值实验验证了置信区间覆盖的准确性与排名推断的可靠性。
- 该框架成功支持了诸如“某一节点在特定社区中是否比另一节点更具代表性”等推断问题,已在金融与社交网络中得到应用。
- 该方法在自展近似误差中实现了 $ o(1) $ 的收敛速度,确保了在大规模网络中的稳健性。
![Figure 2: Left: Scatter plot of $\widehat{\boldsymbol{r}}_{i}$ for $i\in[n]$ . Several representative companies in each corners are highlighted. Right: The test results of $H_{01},H_{02}$ and $H_{03}$ . Red/blue/green means that $H_{01}$ / $H_{02}$ / $H_{03}$ is rejected while grey means that none o](https://ar5iv.labs.arxiv.org/html/2308.14988/assets/figures/simplex.png)
更好的研究,从现在开始
从阅读论文到最终审阅,大幅缩短您的研究时间。
无需绑定信用卡
本解读由 AI 生成,并经人工编辑审核。