
[论文解读] Is there a left-handed magnetic field in the solar neighborhood? Exploring helical magnetic fields in the interstellar medium through dust polarization power spectra
本文研究了太阳系附近是否存在大尺度的左手性螺旋磁场,以解释普朗克数据中总尘埃亮度(T)与B模偏振之间出乎意料的正交叉相关性。通过使用三维螺旋磁场的合成模型,研究发现仅弱的、左手性螺旋磁场结构能够重现观测到的T–B相关性,表明其源于与磁螺旋度相关的宇称奇性,而非小尺度湍流。
The full-sky Planck polarization data at 850um revealed unexpected properties of the E and B mode power spectra of dust emission in the interstellar medium (ISM). The positive cross-correlation between the total dust intensity, T, with the B modes has raised new questions about the physical mechanisms that affect dust polarization, such as the Galactic magnetic-field structure. This is key both to better understanding ISM dynamics and to accurately describing Galactic foregrounds to the polarization of the Cosmic Microwave Background (CMB). In this theoretical paper we investigate the possibility that the observed cross-correlations in the dust polarization power spectra, and specifically between T and B, can be related to a parity-odd quantity in the ISM such as the magnetic helicity. We produce synthetic dust polarization data, derived from 3D analytical toy models of density structures and helical magnetic fields, to compare with the E and B modes of observations. Focusing on the observed T-B correlation, we propose a new line of interpretation of the Planck observations based on a large-scale helical component of the Galactic magnetic field in the solar neighborhood. Our analysis shows that: I) the sign of magnetic helicity does not affect E and B modes for isotropic magnetic-field configurations; II) helical magnetic fields threading interstellar filaments cannot reproduce the Planck results; III) a weak helical left-handed magnetic field structure in the solar neighborhood may explain the T-B correlation seen in the Planck data. This work suggests a new perspective for the interpretation of the dust polarization power spectra, which strongly supports the imprint of a large-scale structure of the Galactic magnetic field in the solar neighborhood.
研究动机与目标
- 研究普朗克尘埃偏振数据中出乎意料的T–B正交叉相关性的起源。
- 评估磁螺旋度——一种宇称奇性量——是否能解释观测到的T–B相关性。
- 检验大尺度螺旋磁场而非小尺度湍流是否对观测到的偏振功率谱负 责。
- 评估磁螺旋度在塑造星际介质中E模与B模功率谱中的作用。
- 基于太阳系附近大尺度螺旋银河磁场,提出对普朗克数据的新解释。
提出的方法
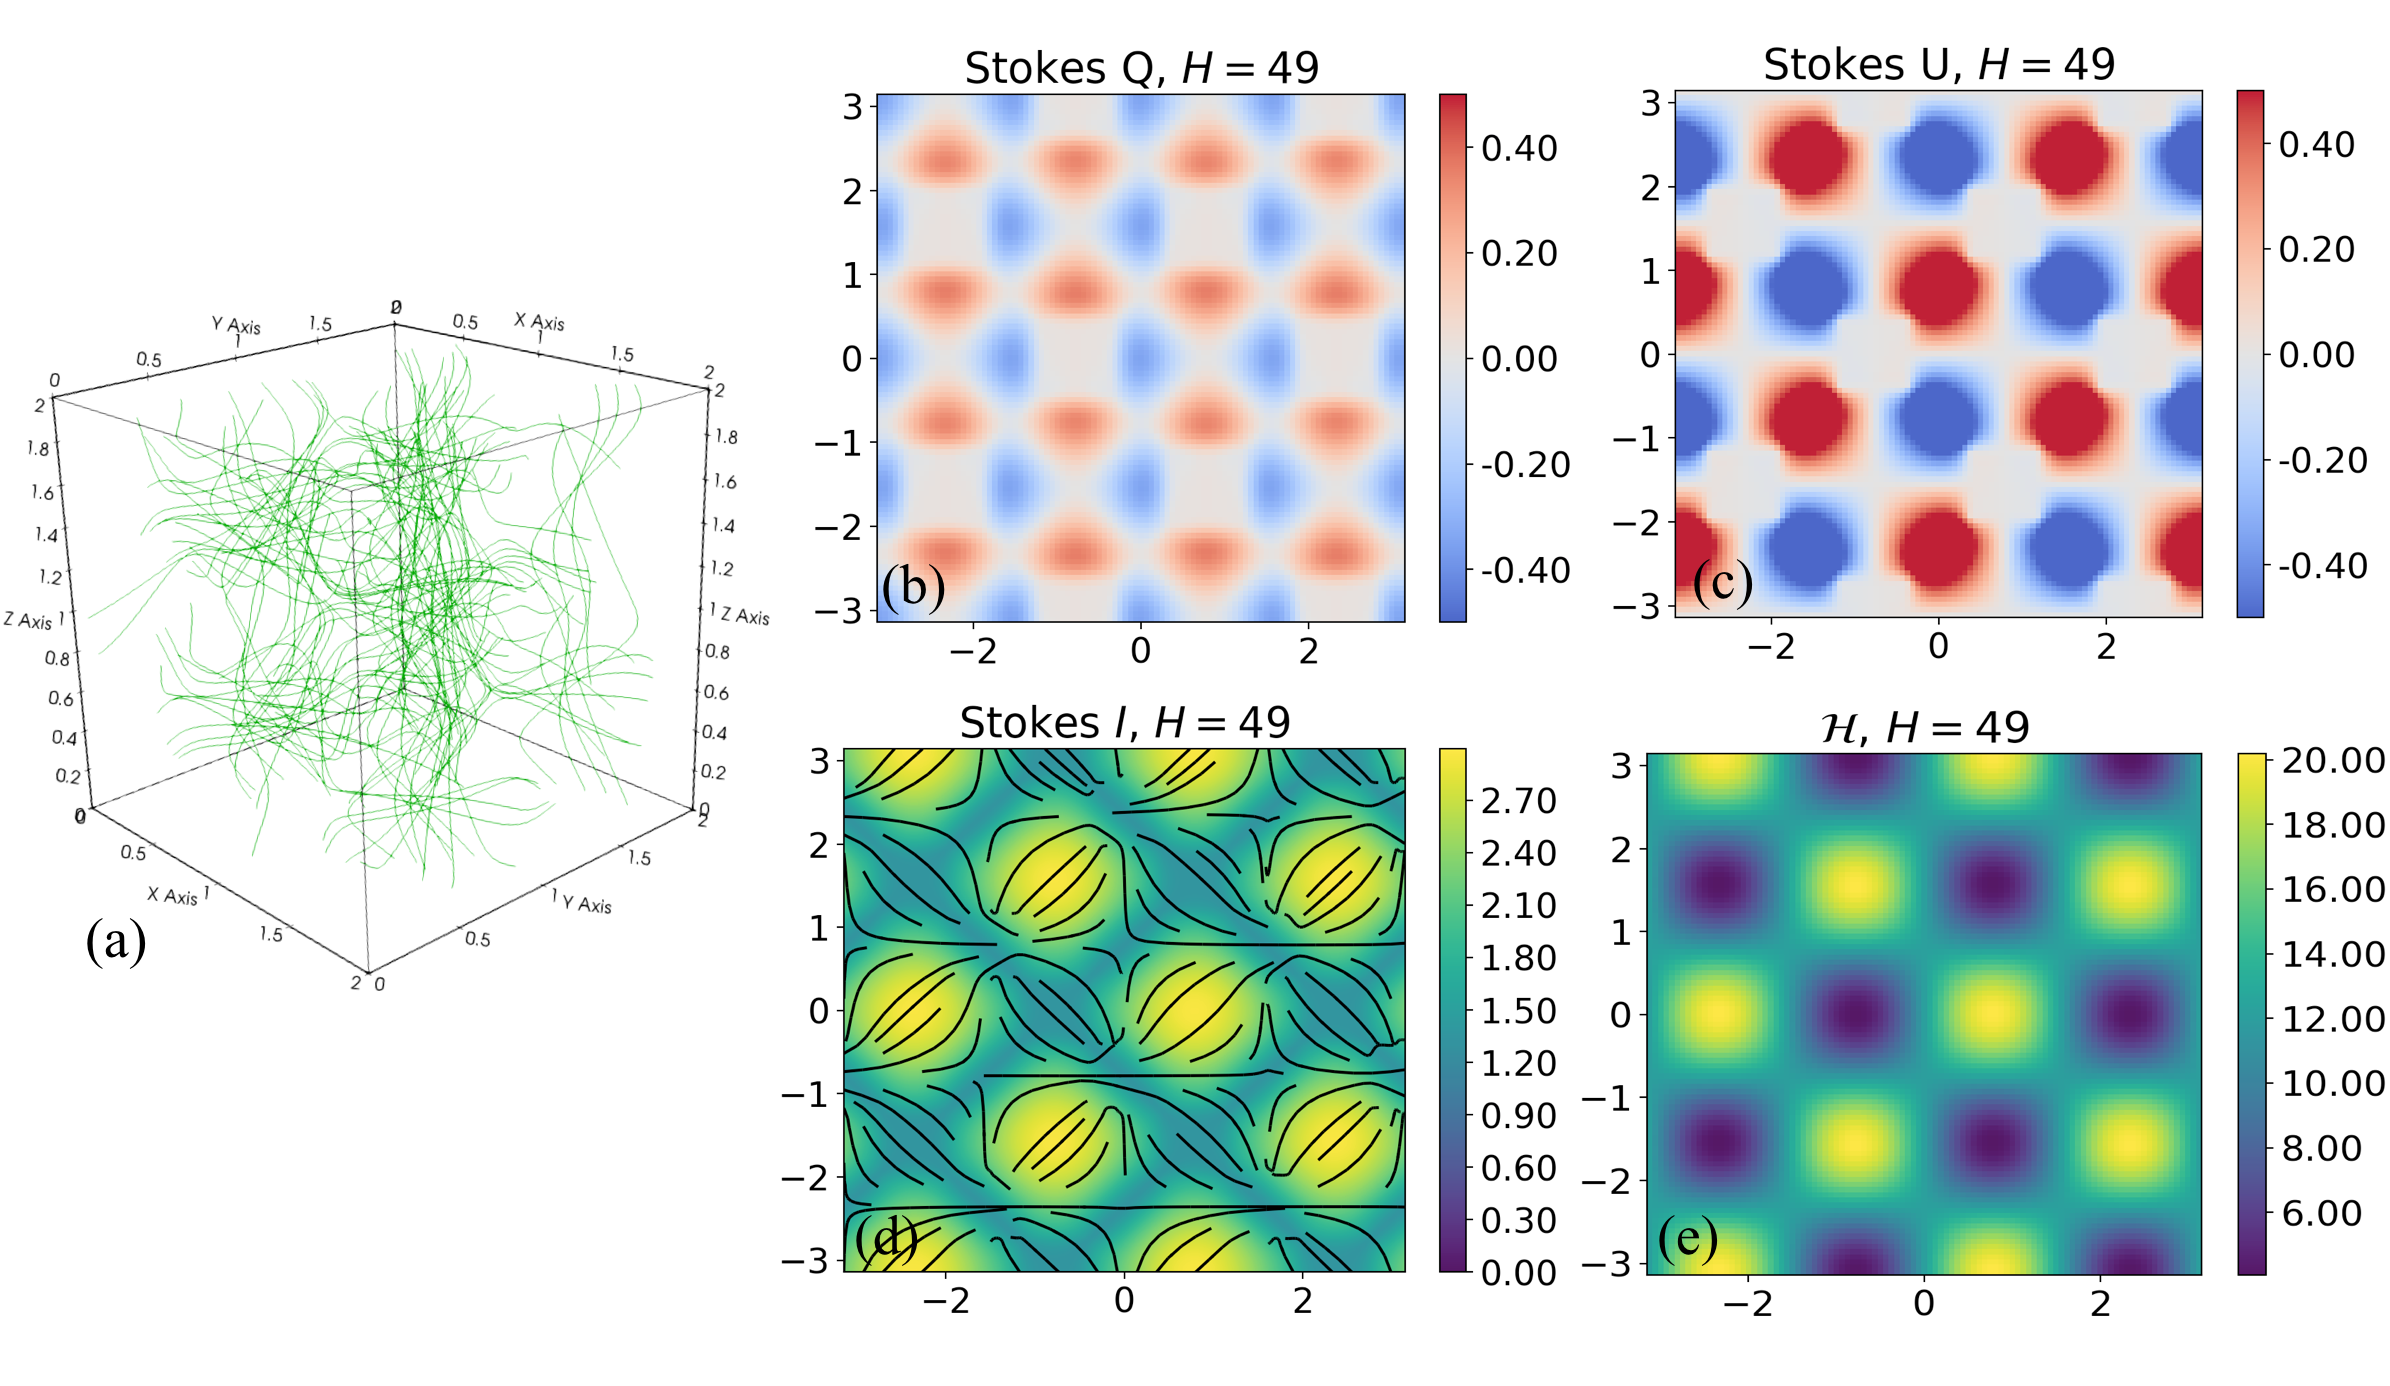
- 使用三维密度结构与螺旋磁场的解析玩具模型生成合成尘埃偏振数据。
- 实施三种模型类型:(1) 各向同性的阿诺德-贝尔特拉米-奇尔德斯场,(2) 包裹在星际丝状结构周围的螺旋磁场,(3) 太阳系附近弱大尺度左手性螺旋磁场。
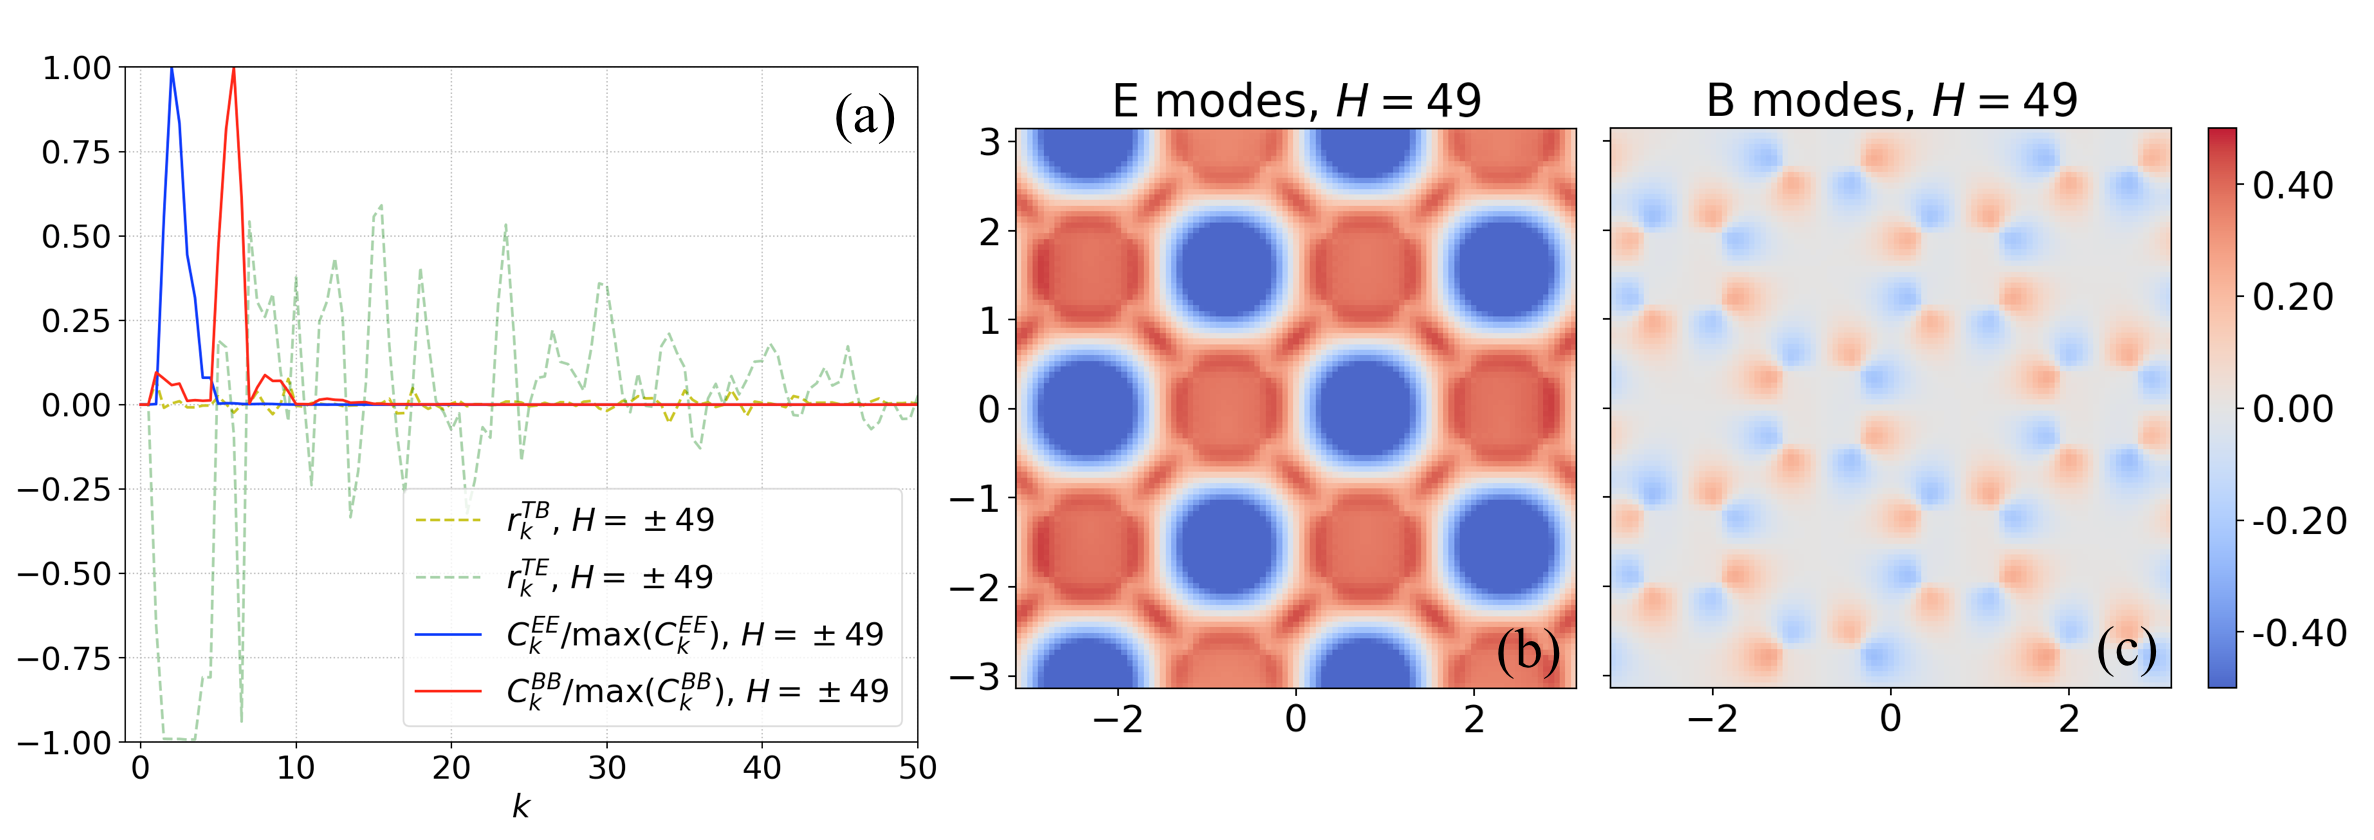
- 将模拟的E模与B模功率谱与普朗克观测到的功率谱及交叉相关性(T–E与T–B)进行比较。
- 采用E–B模分解分析偏振的宇称奇性与宇称偶性分量,重点关注磁螺旋度的作用。
- 对不同螺旋度构型下E模与B模的相对功率进行定量分析。
- 评估T–B相关性强度随螺旋度符号与幅度的变化,特别是在大尺度(l < 50)区域。
实验结果
研究问题
- RQ1磁螺旋度能否解释普朗克尘埃偏振数据中观测到的正T–B交叉相关性?
- RQ2在各向同性磁场构型下,磁螺旋度的符号是否影响E模与B模功率谱?
- RQ3穿过星际丝状结构的螺旋磁场能否重现普朗克数据中观测到的T–B相关性?
- RQ4太阳系附近大尺度左手性螺旋磁场是否与观测到的T–E和T–B相关性一致?
- RQ5弱螺旋磁场结构能否同时解释T–E与T–B相关性?
主要发现
- 在各向同性磁场构型下,磁螺旋度的符号不影响E模与B模功率谱。
- 穿过星际丝状结构的螺旋磁场无法重现普朗克数据中观测到的T–B相关性。
- 太阳系附近(约100–300 pc范围内)的弱左手性螺旋磁场结构可定量解释观测到的正T–B相关性。
- 此类螺旋磁场结构同样能解释在多极数l < 50时观测到的大尺度T–E相关性。
- 在螺旋度存在的情况下,B模与E模的相对功率并非恒定,左手性螺旋度下B模功率相对于E模有所增加。
- 结果表明范式转变:T–B相关性可能源于银河磁场的大尺度螺旋分量,而非小尺度磁流体动力学湍流。
更好的研究,从现在开始
从阅读论文到最终审阅,大幅缩短您的研究时间。
无需绑定信用卡
本解读由 AI 生成,并经人工编辑审核。