
[Paper Review] Mapping dusty galaxy growth at $z>5$ with FRESCO: Detection of H$α$ in submm galaxy HDF850.1 and the surrounding overdense structures
This study presents the first secure Hα detection at z > 5 from the submillimeter galaxy HDF850.1 using NIRCam grism spectroscopy from the FRESCO program on JWST. The 13σ Hα detection confirms a high-redshift overdensity hosting 100 galaxies at z ≈ 5.18, indicating HDF850.1 resides in a dense protocluster likely evolving into a >10¹⁴ M☉ cluster by z ≈ 0, with enhanced SFRs and masses in the overdense environment.
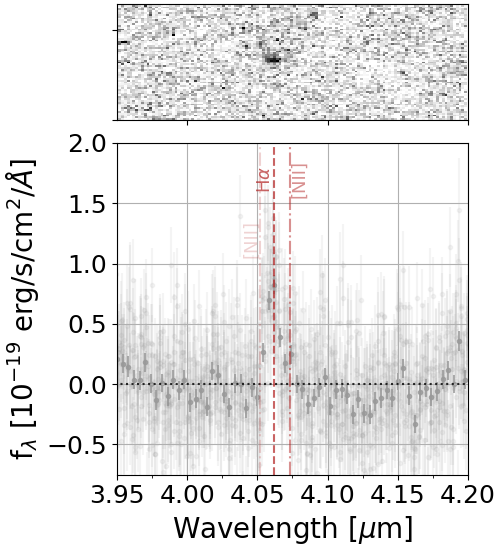
We report the detection of a 13$σ$ H$α$ emission line from HDF850.1 at $z=5.188\pm0.001$ using the FRESCO NIRCam F444W grism observations. Detection of H$α$ in HDF850.1 is noteworthy, given its high far-IR luminosity, substantial dust obscuration, and the historical challenges in deriving its redshift. HDF850.1 shows a clear detection in the F444W imaging data, distributed between a northern and southern component, mirroring that seen in [CII] from the Plateau de Bure Interferometer. Modeling the SED of each component separately, we find that the northern component has a higher mass, star formation rate (SFR), and dust extinction than the southern component. The observed H$α$ emission appears to arise entirely from the less-obscured southern component and shows a similar $Δ$v$\sim$+130 km/s velocity offset to that seen for [CII] relative to the source systemic redshift. Leveraging H$α$-derived redshifts from FRESCO observations, we find that HDF850.1 is forming in one of the richest environments identified to date at $z>5$, with 100 $z=5.17-5.20$ galaxies distributed across 10 structures and a $\sim$(15 cMpc)$^3$ volume. Based on the evolution of analogous structures in cosmological simulations, the $z=5.17-5.20$ structures seem likely to collapse into a single $>$10$^{14}$ $M_{\odot}$ cluster by $z\sim0$. Comparing galaxy properties forming within this overdensity with those outside, we find the masses, SFRs, and $UV$ luminosities inside the overdensity to be clearly higher. The prominence of H$α$ line emission from HDF850.1 and other known highly-obscured $z>5$ galaxies illustrates the potential of NIRCam-grism programs to map both the early build-up of IR-luminous galaxies and overdense structures.
Motivation & Objective
- To detect Hα emission from HDF850.1, a highly obscured, far-IR-luminous submillimeter galaxy at z > 5, using JWST NIRCam grism spectroscopy.
- To determine the redshift and physical properties of HDF850.1 and its environment using Hα and ancillary data.
- To assess the role of overdense structures in early galaxy growth by comparing galaxy properties inside and outside the overdensity.
- To evaluate the potential of NIRCam grism surveys for mapping dusty, high-redshift galaxies and their large-scale environments.
Proposed method
- Utilized deep NIRCam F444W grism observations from the FRESCO program to obtain spectroscopic redshifts via Hα emission detection.
- Performed source extraction and flux measurement on grism spectra to identify a 13σ Hα emission line at z = 5.188 ± 0.001.
- Modeled the spectral energy distribution (SED) of the northern and southern components of HDF850.1 separately to derive stellar mass, SFR, and dust extinction.
- Cross-matched Hα-derived redshifts with existing submillimeter and [CII] data to identify a large overdensity of 100 galaxies at z ≈ 5.17–5.20 across 10 structures.
- Used cosmological simulations to infer the future evolution of the overdensity into a massive z ≈ 0 cluster.
- Compared galaxy properties (mass, SFR, UV luminosity) inside and outside the overdensity to assess environmental effects.
![Figure 1: Images centered on HDF850.1 from both HST in the F814W band ( left panel ) and JWST /NIRCam in the F182M+F210M ( center panel ) and F444W bands ( right panel ). The blue and red solid lines contours in the left panel show the 3, 4, 5, 6, 7, and 8 $\sigma$ contours for [CII] emission from t](https://ar5iv.labs.arxiv.org/html/2309.04525/assets/Fig/filterstamps.png)
Experimental results
Research questions
- RQ1What is the redshift and physical nature of the submillimeter galaxy HDF850.1, and can its Hα emission be securely detected at z > 5 using JWST?
- RQ2What is the large-scale structure environment of HDF850.1, and how many galaxies are associated with it at z ≈ 5.18?
- RQ3How do the stellar masses, star formation rates, and UV luminosities of galaxies in the overdensity compare to those in the field?
- RQ4To what extent does the overdensity represent a progenitor of a massive z ≈ 0 cluster, based on cosmological simulations?
- RQ5Can NIRCam grism spectroscopy effectively map the distribution and properties of dusty, high-redshift star-forming galaxies in dense environments?
Key findings
- A 13σ Hα emission line was detected from HDF850.1 at z = 5.188 ± 0.001, confirming its redshift and resolving long-standing uncertainties.
- The Hα emission arises exclusively from the less-obscured southern component of HDF850.1, which has a velocity offset of ∼+130 km/s relative to the systemic redshift.
- The overdensity contains 100 galaxies at z ≈ 5.17–5.20 distributed across 10 structures within a ∼(15 cMpc)³ volume.
- Galaxies in the overdensity exhibit significantly higher stellar masses, SFRs, and UV luminosities than field galaxies, with evidence for >3σ significance.
- The overdensity is likely to evolve into a single massive cluster of >10¹⁴ M☉ by z ≈ 0, based on cosmological simulations.
- The study demonstrates the power of NIRCam grism spectroscopy to detect Hα in dusty, high-redshift galaxies and map their large-scale environments.
Better researchstarts right now
From reading papers to final review, dramatically reduce your research time.
No credit card · Free plan available
This review was created by AI and reviewed by human editors.