[论文解读] Visual CoT: Advancing Multi-Modal Language Models with a Comprehensive Dataset and Benchmark for Chain-of-Thought Reasoning
Visual CoT 引入 Visual Chain-of-Thought 管线和一个 373k-item 的 visual CoT 数据集,以实现多轮、区域聚焦推理在多模态大语言模型中,提高可解释性和性能。它还提供一个基准和预训练的 VisCoT 模型。
Multi-Modal Large Language Models (MLLMs) have demonstrated impressive performance in various VQA tasks. However, they often lack interpretability and struggle with complex visual inputs, especially when the resolution of the input image is high or when the interested region that could provide key information for answering the question is small. To address these challenges, we collect and introduce the large-scale Visual CoT dataset comprising 438k question-answer pairs, annotated with intermediate bounding boxes highlighting key regions essential for answering the questions. Additionally, about 98k pairs of them are annotated with detailed reasoning steps. Importantly, we propose a multi-turn processing pipeline that dynamically focuses on visual inputs and provides interpretable thoughts. We also introduce the related benchmark to evaluate the MLLMs in scenarios requiring specific local region identification. Extensive experiments demonstrate the effectiveness of our framework and shed light on better inference strategies. The Visual CoT dataset, benchmark, and pre-trained models are available on https://hao-shao.com/projects/viscot.html to support further research in this area.
研究动机与目标
- Address lack of intermediate visual Chain-of-Thought supervision in VQA and related tasks.
- Enable dynamic, multi-turn visual reasoning by identifying and focusing on key image regions.
- Provide a scalable Visual CoT dataset and benchmark to evaluate region-specific reasoning in MLLMs.
提出的方法
- Propose a two-turn multi-modal pipeline (VisCoT) that jointly uses global and localized image regions.
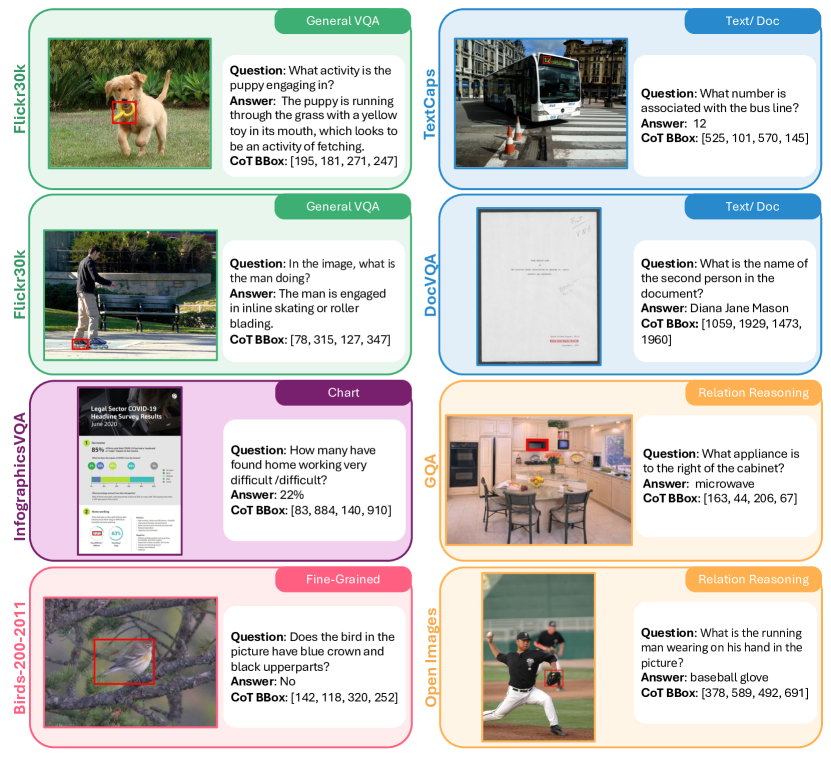
- Create Visual CoT dataset with 373k QA pairs annotated with bounding boxes highlighting key regions for answering questions.
- Train VisCoT using a two-stage process: initial caption-based pre-training then fine-tuning with visual CoT data.
- Introduce a Visual CoT benchmark to evaluate MLLMs on tasks requiring focus on local regions and reasoning about regions.
- Use a visual sampler to crop and process localized image regions and integrate them with global image features in the MLLM.
实验结果
研究问题
- RQ1Can visual CoT data improve interpretability and accuracy of MLLMs on region-focused visual reasoning tasks?
- RQ2How does dynamic region-focused processing affect performance across VQA, reading/infographics, and relation-reasoning datasets?
- RQ3What is the impact of bounding-box quality and sampling strategy on Visual CoT effectiveness?
主要发现
- VisCoT achieves improved performance on the Visual CoT benchmark, especially in doc/text and high-resolution visual tasks.
- Using visual CoT can yield up to 8× performance gains on SROIE relative to a baseline without CoT.
- The visual CoT pipeline can be effective even at lower image resolutions and with fewer visual tokens.
- Ground-truth (GT) bounding boxes provide an upper bound and significantly boost performance, indicating bbox accuracy is crucial.
- Ablations show that expanded contextual cropping and prompting that revisits the original question after the localized image improve accuracy.
- VisCoT compares favorably with several SoTA methods on multiple benchmarks, demonstrating generalization across tasks.

更好的研究,从现在开始
从论文设计到论文写作,大幅缩短您的研究时间。
无需绑定信用卡
本解读由 AI 生成,并经人工编辑审核。