
[Paper Review] Yielding under the microscope: a multi-scale perspective on brittle and ductile behaviors in oscillatory shear
This study presents a multi-scale analysis of yielding in soft materials under oscillatory shear, combining macroscopic rheology with microscale particle tracking to reveal how dynamic heterogeneity and viscoplastic fragility govern brittle-to-ductile transitions. By measuring local strain, particle mobility, and dynamic susceptibility χ₄, the authors show that peak dynamic heterogeneity correlates with viscoplastic fragility and occurs near the yield point, revealing a universal link between microscopic intermittency and macroscopic mechanical response in disordered materials.
We study the yielding transition in soft jammed materials under oscillatory shear, employing a novel methodology that combines rheological measurements with detailed dynamical observations. This method provides a comprehensive view of the intricate interactions between macroscopic mechanical behavior, mesoscopic deformation patterns, and microscopic dynamics during yielding. Our findings reveal two distinct yielding behaviors: at one end, a smooth, uniform transition, characterized by homogeneous strain fields, and Fickian, Gaussian microscopic dynamics; at the other, a sharp transition defined by pronounced shear banding, with the dynamics within shear bands being governed exclusively by the local strain, and exhibiting non-Gaussian, cooperative nature. The viscoplastic fragility emerges as a key macroscopic predictor of these intricate behaviors across micro- and meso-scales, providing a new perspective to understand and quantify ductile and brittle yielding in soft materials.
Motivation & Objective
- To understand the microscopic origins of brittle and ductile behaviors in soft materials during oscillatory shear.
- To quantify dynamic heterogeneity in particle mobility across different yield regimes using high-resolution rheomicroscopy.
- To link macroscopic viscoplastic fragility with local particle-scale dynamics and spatial correlations.
- To develop a robust method for measuring dynamic susceptibility χ₄ that corrects for long-range velocity correlations.
- To establish a connection between the peak of dynamic heterogeneity and the onset of yielding in disordered soft materials.
Proposed method
- Combined strain-controlled rheology using an Anton Paar MCR501 rheometer with cone-plate geometry to measure storage and loss moduli, and stress-strain responses.
- Employed a custom-built stress-controlled shear cell with high-speed imaging to track tracer particle displacements at multiple axial positions (z-scan) and over long timescales (echo sequences).

- Used image cross-correlation to compute local deformation γₗ(z,t) from particle displacement fields, enabling spatially resolved strain measurement.
- Defined particle mobility via an overlap function oⁱ(n,Δn) based on displacement in the vorticity direction, and computed dynamic susceptibility χ₄(Δn) using both single-particle and four-point correlation functions.
- Corrected for spurious long-range correlations in χ₄ by subtracting a baseline from the four-point correlator G₄(Δr,Δn) over distances r > 200 μm.
- Normalized χ₄ by particle surface density φ to enable cross-sample comparison, with d = 0.15 μm as the optimal characteristic distance for the overlap function.
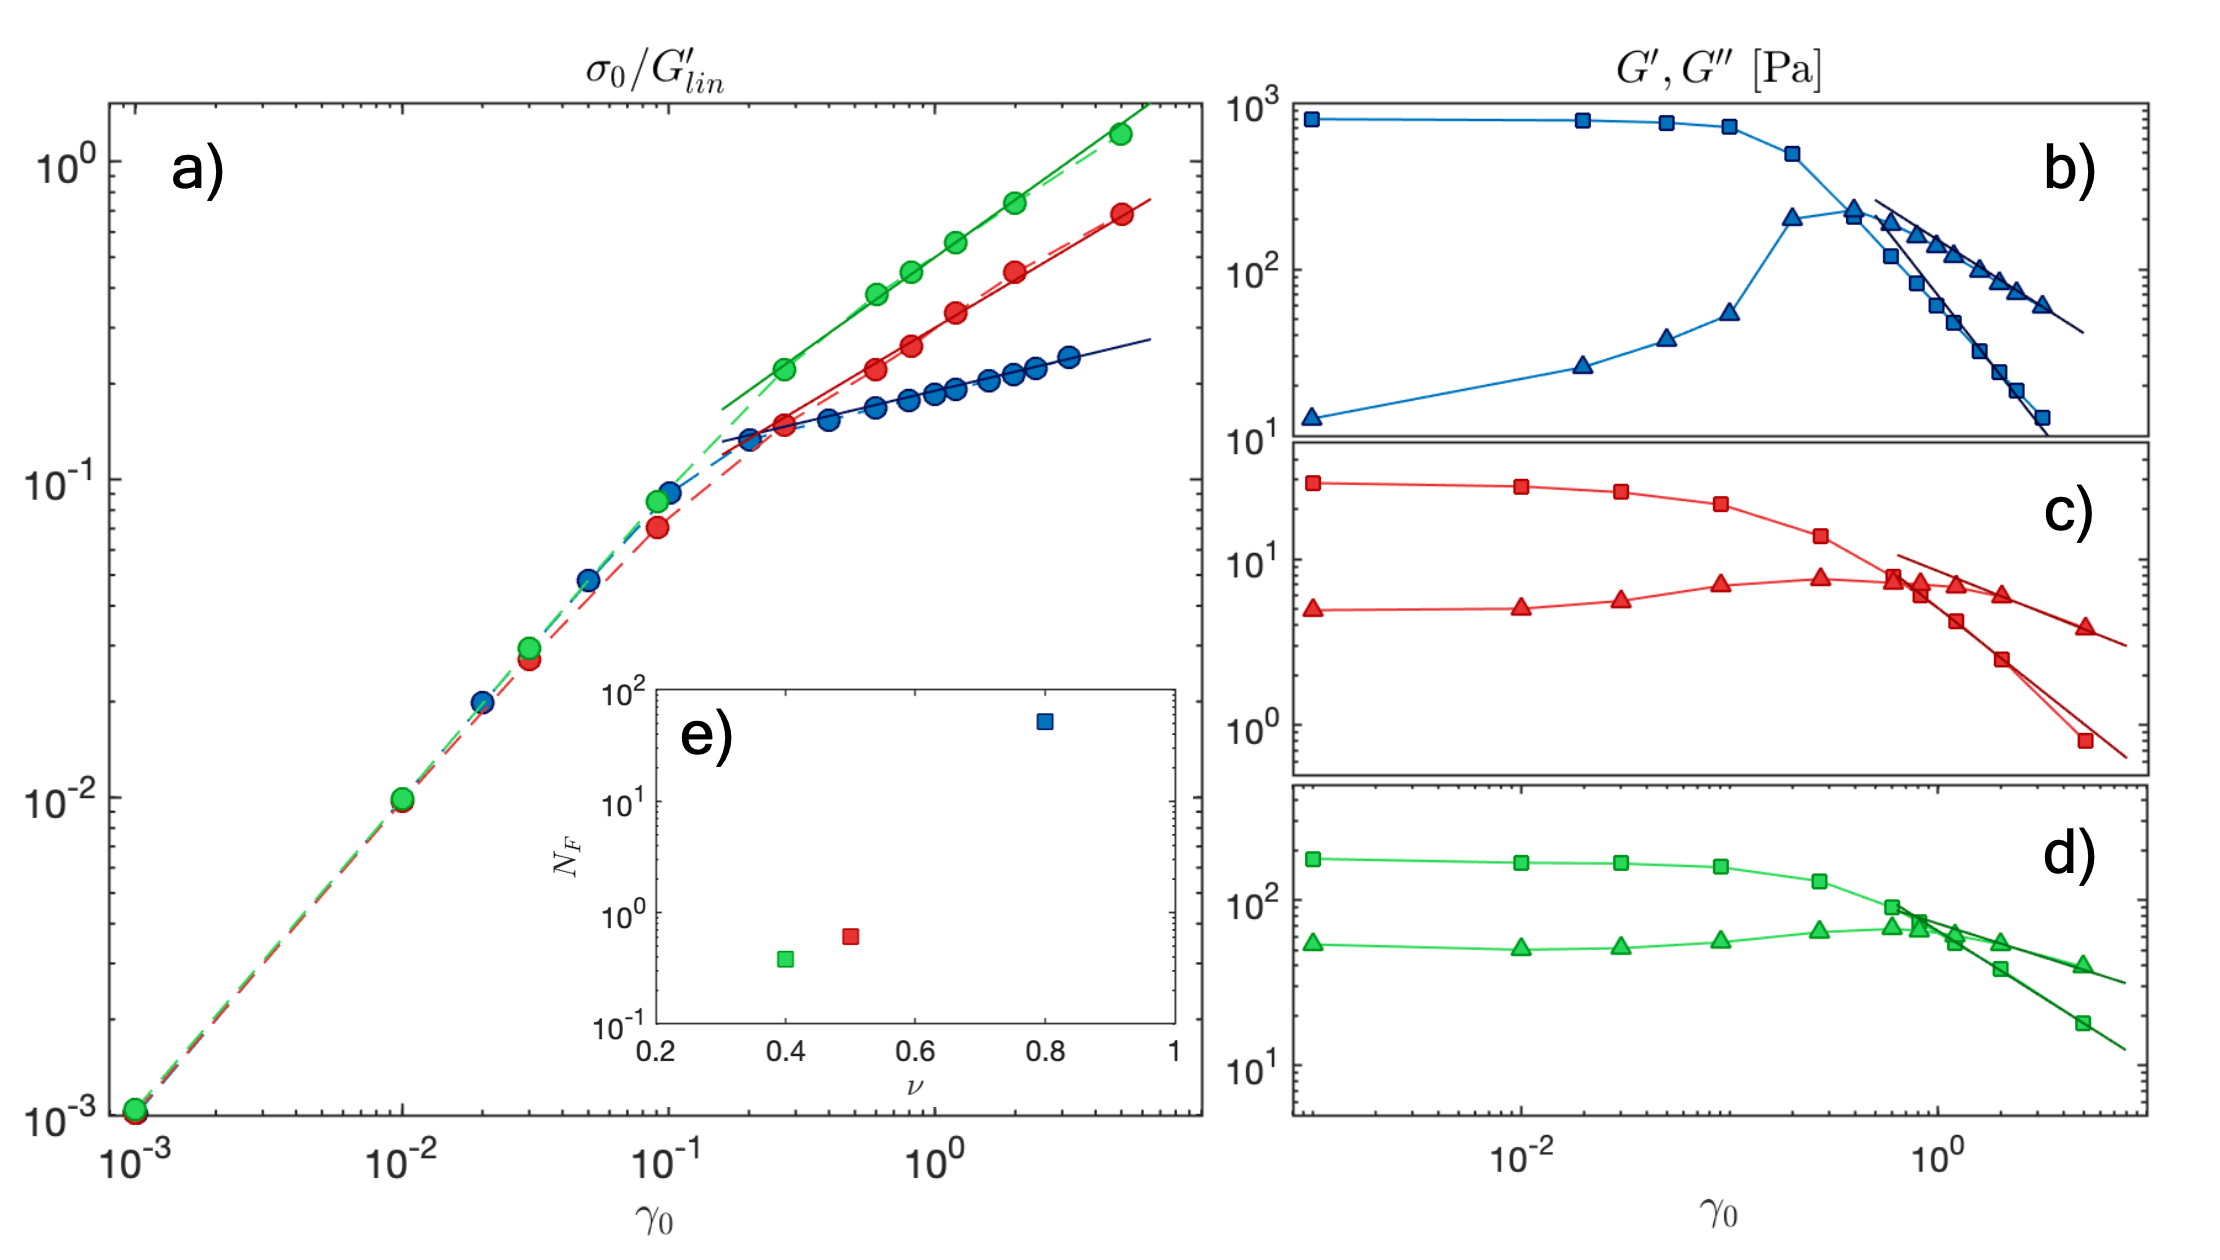
Experimental results
Research questions
- RQ1How does dynamic heterogeneity, quantified by χ₄, evolve near the yield point in soft materials under oscillatory shear?
- RQ2What is the relationship between viscoplastic fragility N_F and the spatial and temporal correlations of particle motion?
- RQ3To what extent do long-range velocity correlations distort the measurement of dynamic heterogeneity in rheomicroscopy?
- RQ4Can the peak of dynamic susceptibility χ₄ be used as a reliable indicator of the onset of yielding in disordered soft materials?
- RQ5How do the mechanical response (e.g., power-law behavior in stress-strain curves) and local particle dynamics co-evolve across different yield regimes?
Key findings
- The viscoplastic fragility N_F, derived from the slope of the fluid loss modulus G′′_fluid with respect to log(γ₀), correlates strongly with the peak of dynamic susceptibility χ₄, indicating a link between macroscopic fragility and microscopic heterogeneity.
- Peak dynamic heterogeneity χ₄(Δn) occurs at Δn ≈ 10–20 cycles, corresponding to the regime where the material is most susceptible to yielding, and this peak shifts toward earlier times as the applied stress increases.
- The four-point correlation function G₄(Δr,Δn) does not decay to zero at large distances due to large-scale velocity correlations, necessitating baseline subtraction for accurate χ₄ extraction.
- After baseline correction, χ₄(Δn) exhibits a clear peak that scales with the applied stress and aligns with the onset of non-linear behavior in the stress-strain curve.
- For all three samples—emulsion, Carbopol 0.5 wt%, and Carbopol 5 wt%—the normalized χ₄ shows a maximum near the yield stress, confirming the universality of dynamic heterogeneity at yielding.
- The optimal characteristic distance d = 0.15 μm for the overlap function was selected based on stability of χ₄(Δn) across different d values and the existence of a plateau region in functional form.
Better researchstarts right now
From reading papers to final review, dramatically reduce your research time.
No credit card · Free plan available
This review was created by AI and reviewed by human editors.