
[论文解读] Additive Covariance Matrix Models: Modelling Regional Electricity Net-Demand in Great Britain
本文提出了一种基于改进Cholesky分解的多元正态分布加法协方差矩阵模型,用于联合预测英国14个输电区域的区域净负荷,实现空间一致的、概率性的预测,能够捕捉时变依赖关系与变异性。在排除极端天气事件后,该模型在关键指标上优于非高斯对 copula 基础的替代方案,展现出更优的预测准确性和可解释性,适用于电力系统运行。
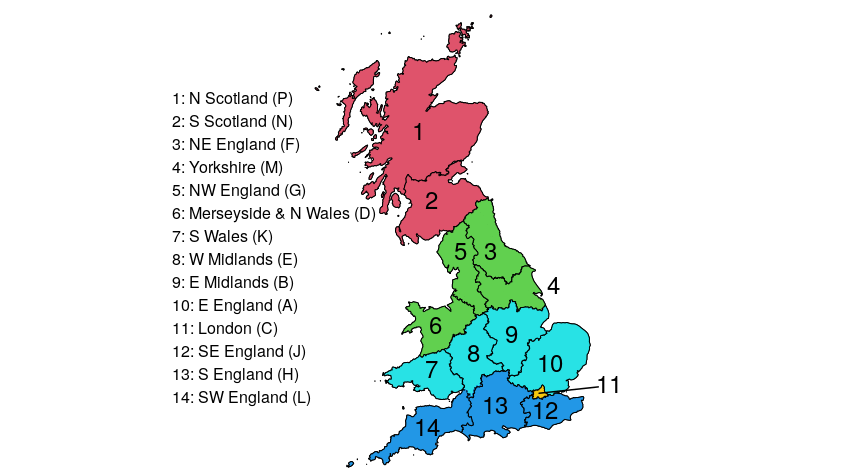
Forecasts of regional electricity net-demand, consumption minus embedded generation, are an essential input for reliable and economic power system operation, and energy trading. While such forecasts are typically performed region by region, operations such as managing power flows require spatially coherent joint forecasts, which account for cross-regional dependencies. Here, we forecast the joint distribution of net-demand across the 14 regions constituting Great Britain's electricity network. Joint modelling is complicated by the fact that the net-demand variability within each region, and the dependencies between regions, vary with temporal, socio-economical and weather-related factors. We accommodate for these characteristics by proposing a multivariate Gaussian model based on a modified Cholesky parametrisation, which allows us to model each unconstrained parameter via an additive model. Given that the number of model parameters and covariates is large, we adopt a semi-automated approach to model selection, based on gradient boosting. In addition to comparing the forecasting performance of several versions of the proposed model with that of two non-Gaussian copula-based models, we visually explore the model output to interpret how the covariates affect net-demand variability and dependencies. The code for reproducing the results in this paper is available at https://doi.org/10.5281/zenodo.7315105, while methods for building and fitting multivariate Gaussian additive models are provided by the SCM R package, available at https://github.com/VinGioia90/SCM.
研究动机与目标
- 开发一种用于英国14个输电区域的区域电力净负荷的、空间一致的概率预测模型。
- 建模由时间、社会经济和气象因素驱动的时变净负荷变异性与区域间依赖关系。
- 确保在极端条件下对关键电力系统运行的预测具有可解释性和可信度。
- 支持对动态网络边界上的潮流分析进行灵活的预测后处理。
- 将所提出的高斯加法模型与非高斯对 copula 基础的替代方案进行性能比较。
提出的方法
- 采用改进的Cholesky参数化方法构建多元正态模型,以确保协方差矩阵为正定矩阵。
- 每个无约束的Cholesky参数通过加法预测器建模,实现对协方差结构的灵活、非参数化建模。
- 在加法模型中纳入日历效应、气温和可再生能源发电等协变量,以捕捉时变依赖关系。
- 采用基于梯度提升的半自动模型选择方法,以处理高维参数空间。
- 使用SCM R包拟合模型,通过对数评分、CRPS和分位数评分评估概率预测性能。
- 在完整区域数据和聚合后的宏观区域上评估性能,并分析极端天气事件(如“东方寒潮”)的影响。
实验结果
研究问题
- RQ1具有加法协方差结构的多元正态模型能否有效捕捉英国14个区域之间时变的净负荷依赖关系?
- RQ2纳入日历、天气和可再生能源发电协变量后,预测准确性和空间一致性是否得到提升?
- RQ3所提出的加法协方差模型在净负荷的概率预测中是否优于非高斯对 copula 基础的模型?
- RQ4像“东方寒潮”这样的极端天气事件如何影响模型性能?在排除这些事件后,模型是否仍保持鲁棒性?
- RQ5该模型的可解释性程度如何?是否能够支持对动态网络边界上潮流分析的预测后处理?
主要发现
- 在排除‘东方寒潮’寒潮事件后,所提出的高斯加法模型的Full版本和Cal+Ren版本在所有区域和宏观区域中均实现了最佳对数评分表现。
- Full模型在14个GSP区域组上的对数评分为2427,在5个宏观区域上的对数评分为2684,两种情形下均优于所有对 copula 基础模型。
- 该模型在预测极端分位数方面表现尤为出色,伦敦邻近区域的Pin 001和Pin 999评分均低于6.00,表明尾部分位数预测准确。
- CRPS值在14个GSP区域组中持续低于1200,在5个宏观区域中低于370,表明边际预测精度很高。
- 该模型展现出良好的鲁棒性与可解释性,能够清晰可视化气温和可再生能源发电等协变量如何影响净负荷的变异性与依赖关系。
- 在排除极端天气数据后,该模型在边际和联合预测评估指标上均优于非高斯对 copula 基础模型。

更好的研究,从现在开始
从阅读论文到最终审阅,大幅缩短您的研究时间。
无需绑定信用卡
本解读由 AI 生成,并经人工编辑审核。