
[论文解读] All Thresholds Barred: Direct Estimation of Call Density in Bioacoustic Data
本文提出了一种无需阈值的直接估计生物声学数据中叫声密度的方法,通过贝叶斯建模分类器得分,避免了假阳性和假阴性带来的偏差。该方法在不同叫声密度和模型质量下均表现出稳健性能,通过验证方案实现了在分布偏移情况下的准确站点级密度估计。
Passive acoustic monitoring (PAM) studies generate thousands of hours of audio, which may be used to monitor specific animal populations, conduct broad biodiversity surveys, detect threats such as poachers, and more. Machine learning classifiers for species identification are increasingly being used to process the vast amount of audio generated by bioacoustic surveys, expediting analysis and increasing the utility of PAM as a management tool. In common practice, a threshold is applied to classifier output scores, and scores above the threshold are aggregated into a detection count. The choice of threshold produces biased counts of vocalizations, which are subject to false positive/negative rates that may vary across subsets of the dataset. In this work, we advocate for directly estimating call density: The proportion of detection windows containing the target vocalization, regardless of classifier score. Our approach targets a desirable ecological estimator and provides a more rigorous grounding for identifying the core problems caused by distribution shifts -- when the defining characteristics of the data distribution change -- and designing strategies to mitigate them. We propose a validation scheme for estimating call density in a body of data and obtain, through Bayesian reasoning, probability distributions of confidence scores for both the positive and negative classes. We use these distributions to predict site-level densities, which may be subject to distribution shifts. We test our proposed methods on a real-world study of Hawaiian birds and provide simulation results leveraging existing fully annotated datasets, demonstrating robustness to variations in call density and classifier model quality.
研究动机与目标
- 解决被动音频监测(PAM)数据中基于阈值的检测计数引入的偏差问题。
- 开发一种直接估计叫声密度 $P(\oplus)$ 的方法,即目标发声在检测窗口中出现的比例,且独立于分类器得分阈值。
- 提供一个严谨的框架,以处理分布偏移——即不同地点或时间的数据分布变化——这些变化会干扰传统的基于阈值的检测方法。
- 通过估计反映真实发声率而非分类器伪影的站点级叫声密度,实现生态上有意义的推断。
- 通过提供叫声密度估计的置信区间和概率分布,支持生物声学监测中的自适应资源分配。
提出的方法
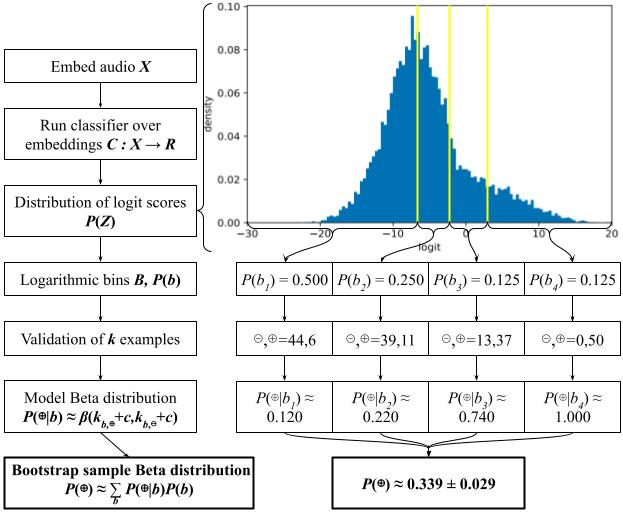
- 使用贝叶斯推断对分类器得分建模,以估计正类($P(z|\oplus)$)和负类($P(z|\ominus)$)的概率分布。
- 通过分类器输出的分箱验证,估计研究群体中得分的累积分布,从而在无需阈值的情况下实现密度估计。
- 应用全概率定律,将检测率 $P(z>t)$ 与真实叫声密度 $P(\oplus)$ 关联起来,同时考虑假阳性率和假阴性率。
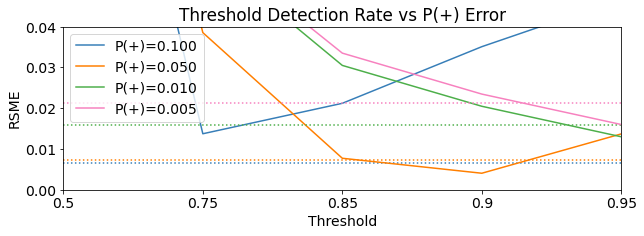
- 实施包含多个分箱(例如4个分箱)的验证方案,以分配分类器得分,并减少极端对数几率带来的偏差,特别是在噪声环境中。
- 使用研究级和站点级的验证数据估计特定站点的叫声密度,通过替代假设处理分布偏移问题。
- 利用连续分布估计(例如核密度估计)作为分箱估计的潜在替代方案,以更好地捕捉如强风山区等高密度区域的特征。
实验结果
研究问题
- RQ1在生物声学监测中,如何在不依赖任意分类器得分阈值的情况下直接估计叫声密度?
- RQ2由于环境、时间或行为变化引起的分布偏移在多大程度上影响基于阈值的检测计数?如何缓解这一影响?
- RQ3分类器得分分布的贝叶斯框架是否能在多样化的生态条件下提供更准确、更稳健的叫声密度估计?
- RQ4验证分箱策略的选择在多大程度上影响叫声密度估计的准确性,特别是在高噪声环境中?
- RQ5所提出的方法是否能通过提供具有不确定性量化的细粒度、站点级密度估计,支持可操作的野生动物管理决策?
主要发现
- 所提出的无阈值方法在真实世界夏威夷鸟类数据上验证后,表现出在不同叫声密度和分类器质量下的稳健叫声密度估计能力。
- 来自强风山区(如茂纳凯阿和茂纳洛亚)的分类器得分高度集中在最高分箱,表明风噪起到了判别性特征的作用,但并未影响叫声密度估计能力。
- 在使用4个分箱且每个分箱200个样本的情况下,所有 ʻUaʻu 的检测结果均落入最高分箱,表明即使整体出现率较低,仍具有高敏感性。
- 通过建模分类器得分的完整分布而非依赖单一阈值,该方法减少了假阳性和假阴性带来的偏差。
- 即使因环境噪声或行为变异导致分布偏移,站点级叫声密度估计仍保持稳定且具有信息量。
- 该方法实现了低时间成本的叫声密度估计,支持可操作的实时野生动物监测,并可评估如蚊媒控制等保护干预措施的效果。
更好的研究,从现在开始
从阅读论文到最终审阅,大幅缩短您的研究时间。
无需绑定信用卡
本解读由 AI 生成,并经人工编辑审核。