
[论文解读] Analysis of full disc Ca II K spectroheliograms III. Plage area composite series covering 1892-2019
本研究基于1892年至2019年期间来自43个数据集的超过29万张全圆盘Ca II K光谱日面图,构建了迄今为止最全面的太阳 plage 面积复合时间序列。通过一致的光度校准、边缘变暗校正以及针对特定站点问题(如京都和叶克斯数据中的明亮弧线)的伪影抑制,作者生成了一个经过校准、交叉验证的复合数据集,自1892年起实现88%的日覆盖度,自1907年起达98%,为太阳色球层磁活动的长期分析提供了可靠基础。
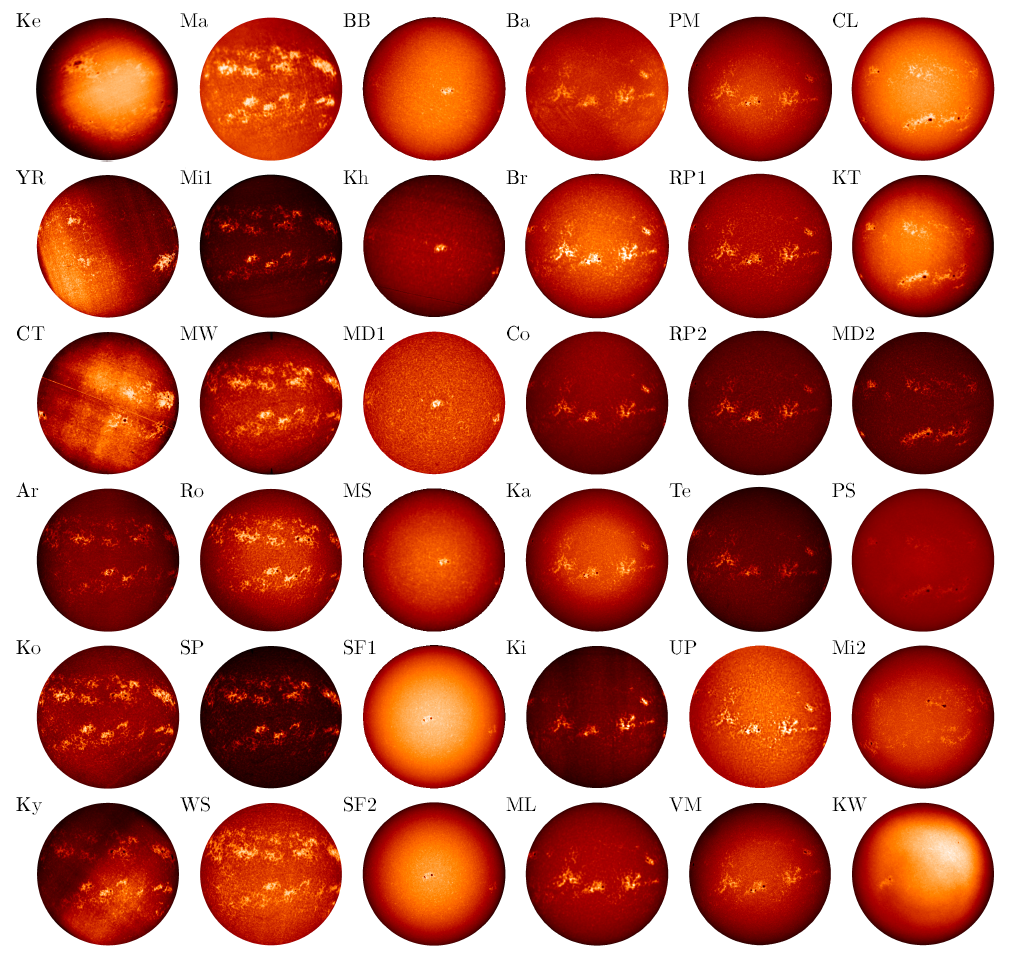
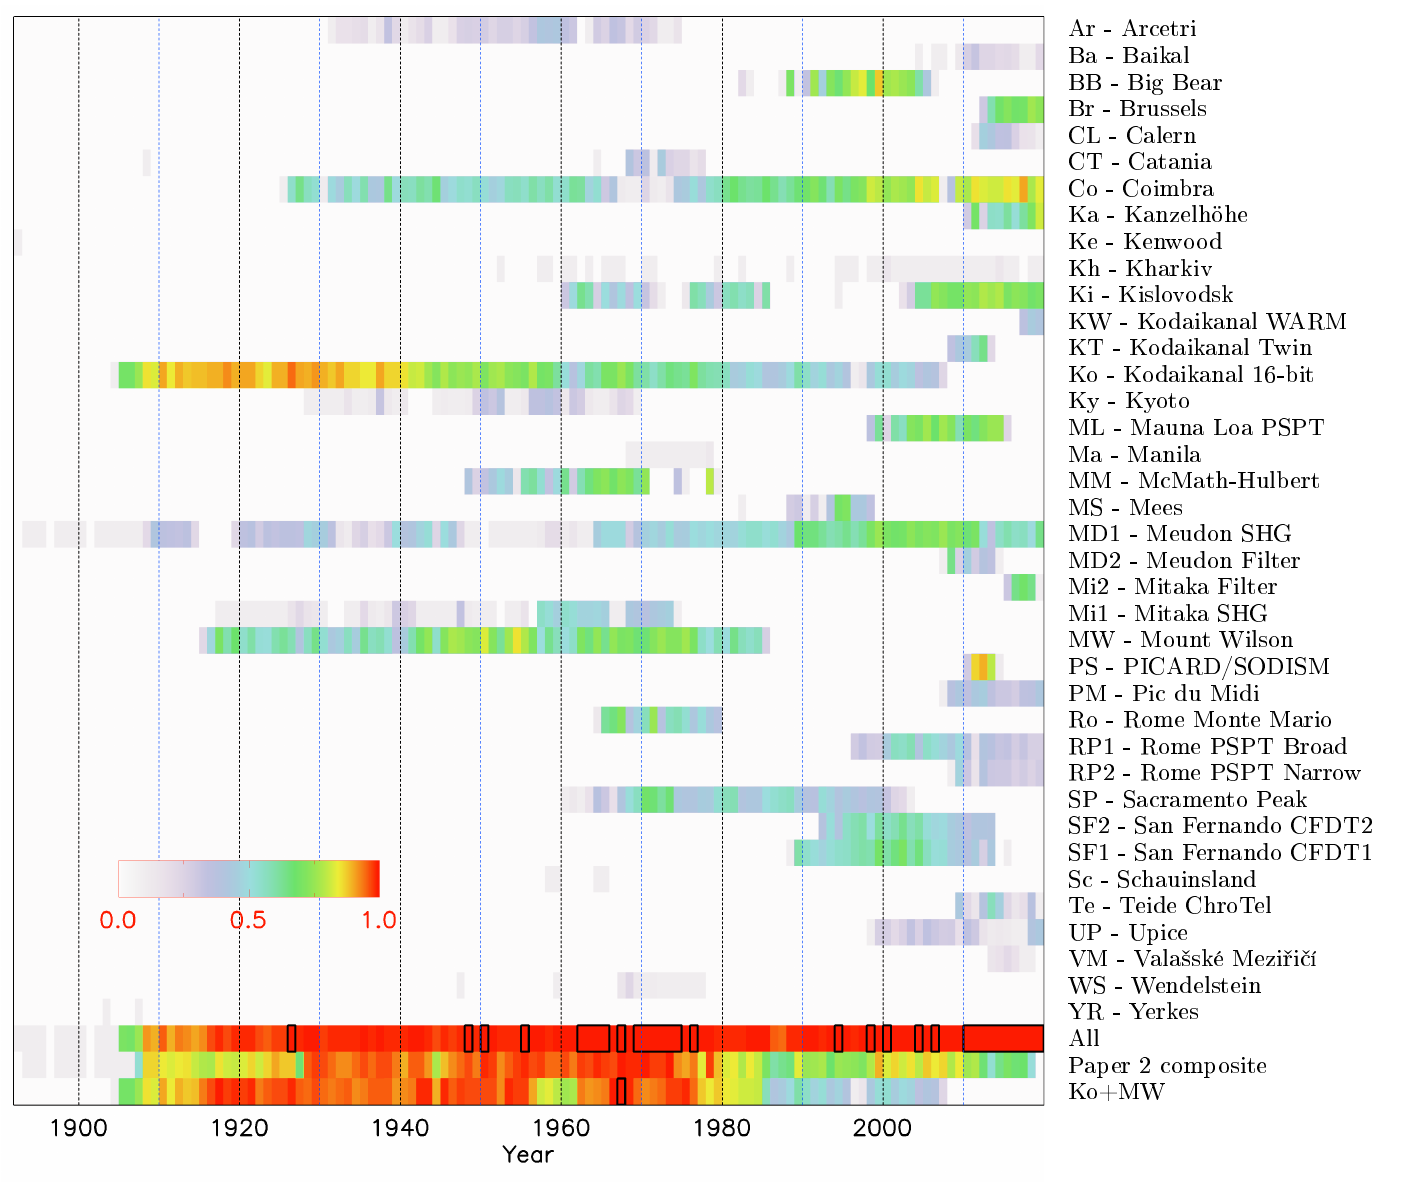
We derive the plage area evolution over the last 12 solar cycles employing data from all Ca II K archives available publicly in digital form known to us, including several as yet unexplored Ca II K archives. We analyse more than 290,000 full-disc Ca II K observations from 43 datasets spanning the period 1892-2019. All images were consistently processed with an automatic procedure that performs the photometric calibration (if needed) and the limb-darkening compensation. The processing also accounts for artefacts plaguing many of the images, including some very specific artefacts such as bright arcs found in Kyoto and Yerkes data. We have produced a plage area time-series from each analysed dataset. We found that the differences between the plage areas derived from individual archives are mainly due to the differences in the central wavelength and the bandpass used to acquire the data at the various sites. We have empirically cross-calibrated and combined the results obtained from each dataset to produce a composite series of plage areas. "Backbone" series are used to bridge all the series together. We have also shown that the selection of the backbone series has little effect on the final plage area composite. We have quantified the uncertainty of determining the plage areas with our processing due to shifts in the central wavelength and found it to be less than 0.01 in fraction of the solar disc for the average conditions found on historical data. We also found the variable seeing conditions during the observations to slightly increase the plage areas during activity maxima. We provide the so far most complete time series of plage areas based on corrected and calibrated historical and modern Ca II K images. Consistent plage areas are now available on 88% of all days from 1892 onwards and on 98% from 1907 onwards.
研究动机与目标
- 利用历史和现代的全圆盘Ca II K光谱日面图,重建长期一致的plage面积时间序列。
- 解决因不同台站在中心波长、通带和仪器伪影差异而引起的plage面积测量不一致问题。
- 生成一个统一、经过校准的复合数据集,实现高时间覆盖率,用于研究12个太阳周期内太阳色球层磁活动。
- 量化由于波长偏移和观测条件变化(如视宁度)导致的plage面积测量不确定性。
- 为未来更新和整合新数字化的历史档案提供支持,确保其可集成至复合时间序列中。
提出的方法
- 使用一致的自动化流程处理来自43个数据集的超过29万张全圆盘Ca II K图像,实现光度校准和边缘变暗补偿。
- 针对特定问题(如京都和叶克斯数据中的明亮弧线)应用基于已知仪器特性的伪影校正技术。
- 利用“骨干”系列对不同台站的数据进行交叉校准和合并,确保复合数据的一致性。
- 通过经验评估中心波长偏移带来的不确定性,发现其在典型历史条件下对相对日面面积的影响小于0.01。
- 考虑视宁度变化的影响,其在太阳活动极大期会轻微高估plage面积。
- 采用模块化方法,通过分段和独立再校准处理不连续性和站点特异性差异。
实验结果
研究问题
- RQ1如何将分散的Ca II K光谱日面图档案一致地校准并整合为单一、连贯的plage面积时间序列?
- RQ2历史plage面积测量中的主要系统性误差来源是什么?如何量化并最小化这些误差?
- RQ3不同台站在中心波长和通带上的差异在多大程度上影响所推导出的plage面积?
- RQ4观测期间大气视宁度的变化,特别是太阳活动极大期,如何影响测量的plage面积?
- RQ5一个跨越125多年的复合plage面积时间序列,其可实现的时间覆盖率和可靠性如何?
主要发现
- 作者构建的复合plage面积时间序列自1892年起实现88%的日覆盖度,自1907年起达98%,显著优于以往工作。
- 用于交叉校准的骨干系列选择对最终复合结果影响极小,表明该方法具有高度稳健性。
- 在典型历史条件下,由于中心波长偏移导致的plage面积测定不确定性小于0.01(相对日面面积)。
- 观测期间视宁度的变化导致plage面积轻微高估,尤其在太阳活动极大期更为明显。
- 该方法成功消除了京都和叶克斯数据中特有的站点伪影(如明亮弧线),显著提升了数据一致性。
- 复合数据集设计支持未来更新和新数字化档案的集成,确保其在太阳变化研究中的长期可用性。
更好的研究,从现在开始
从阅读论文到最终审阅,大幅缩短您的研究时间。
无需绑定信用卡
本解读由 AI 生成,并经人工编辑审核。