[论文解读] Assessing the performance of spatial cross-validation approaches for models of spatially structured data
本论文通过景观模拟比较空间交叉验证方法,发现使用带有空间外部区块及缓冲区的空间CV能获得更准确的性能估计,并在 tidymodels 框架内引入 spatialsample R 包。
Evaluating models fit to data with internal spatial structure requires specific cross-validation (CV) approaches, because randomly selecting assessment data may produce assessment sets that are not truly independent of data used to train the model. Many spatial CV methodologies have been proposed to address this by forcing models to extrapolate spatially when predicting the assessment set. However, to date there exists little guidance on which methods yield the most accurate estimates of model performance. We conducted simulations to compare model performance estimates produced by five common CV methods fit to spatially structured data. We found spatial CV approaches generally improved upon resubstitution and V-fold CV estimates, particularly when approaches which combined assessment sets of spatially conjunct observations with spatial exclusion buffers. To facilitate use of these techniques, we introduce the `spatialsample` package which provides tooling for performing spatial CV as part of the broader tidymodels modeling framework.
研究动机与目标
- 动机:需要空间交叉验证,以避免训练数据中的空间自相关导致的过于乐观的性能评估。
- 系统性地比较使用模拟景观与随机森林的领先空间CV方法。
- 识别能产生准确模型性能估计的参数设置,并提供实用建议。
- 提供一个易于访问的软件工具,在 tidymodels 生态系统中实现空间CV。
提出的方法
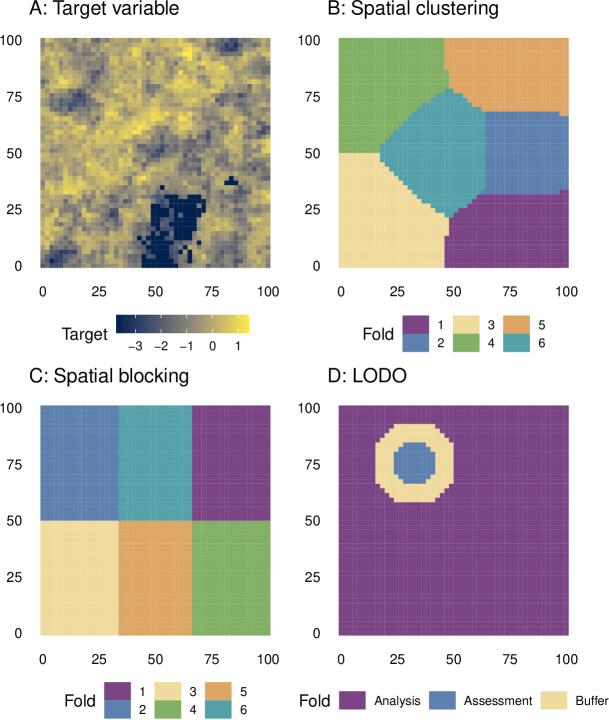
- 在 50x50 网格上模拟了 100 个独立景观,包含 13 个预测变量以及派生目标变量 y。
- 将多种空间CV方法(分块CV、聚类CV、BLO3 CV、LODO CV、BLO3 CV、V-fold CV)与重新替换和标准随机CV进行对比。
- 使用随机森林(ranger)并以预测变量 X2、X3、X6–X10 来预测 y。
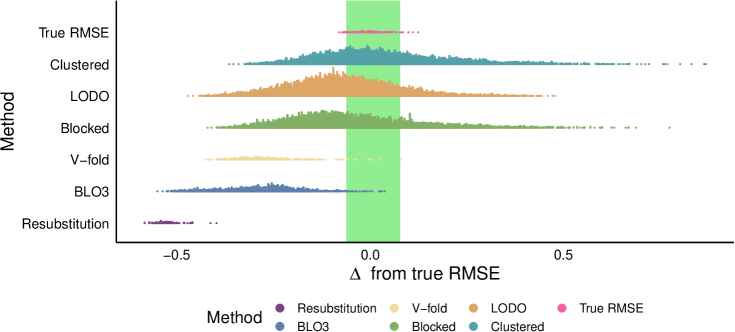
- 以 RMSE 评估模型性能,并将估计值与来自跨景观预测所得的“真实” RMSE 范围进行比较。
- 计算 y 和残差的空间自相关范围,以确定 D_in/D_out 的合适间距。
- 将所有方法实现于 spatialsample,与 tidymodels 基础设施保持一致。
实验结果
研究问题
- RQ1不同的空间交叉验证方法在估计时空结构数据的泛化性能方面表现如何?
- RQ2将空间相关的评估数据与排除缓冲区相结合的空间CV方法是否比其他方法提供更准确的性能估计?
- RQ3哪些参数设置(区块大小、折数、缓冲区、包含半径)能得到最接近真实 RMSE 范围的 RMSE 估计?
- RQ4D_in 与 D_out 之间的间距如何影响性能估计的偏差?
- RQ5tidymodels 内的实用工具能否有效实现这些空间CV方法以用于实际建模流程?
主要发现
- 与重新替换或随机CV相比,空间CV方法通常能提供更准确的性能估计。
- 将空间相关观测的 D_out 与排除缓冲区结合的方法提供了对模型性能的最佳估计。
- 空间聚类和留一 disc-out (LODO) CV 在多种参数设定中是最为一致有效的方法之一。
- 过于激进的数据排除(如折数太少或区块过大)会产生悲观的 RMSE 估计。
- 表现最佳的参数集将 D_out 与 D_in 的间距大约分离为网格长度的 25–41%,与结果的自相关范围相吻合。
- 聚类CV在参数设定上表现出鲁棒性,但可能反映了所考察的参数空间较窄。
更好的研究,从现在开始
从论文设计到论文写作,大幅缩短您的研究时间。
无需绑定信用卡
本解读由 AI 生成,并经人工编辑审核。