
[论文解读] Comparison of Affine and Rational Quadratic Spline Coupling and Autoregressive Flows through Robust Statistical Tests
该论文针对高维多模态分布(4D至400D)对仿射和有理二次样条耦合流以及自回归流(RealNVP、MAF、C-RQS、A-RQS)进行了严谨的对比研究。通过使用稳健的两样本检验统计量——切片Wasserstein距离、Kolmogorov-Smirnov检验以及相关系数差异的Frobenius范数,结果表明A-RQS在准确性和训练速度方面始终优于其他架构,而C-RQS在高维下表现出不稳定性和高昂的训练成本。
Normalizing flows have emerged as a powerful brand of generative models, as they not only allow for efficient sampling of complicated target distributions but also deliver density estimation by construction. We propose here an in-depth comparison of coupling and autoregressive flows, both based on symmetric (affine) and non-symmetric (rational quadratic spline) bijectors, considering four different architectures: real-valued non-Volume preserving (RealNVP), masked autoregressive flow (MAF), coupling rational quadratic spline (C-RQS), and autoregressive rational quadratic spline (A-RQS). We focus on a set of multimodal target distributions of increasing dimensionality ranging from 4 to 400. The performances were compared by means of different test statistics for two-sample tests, built from known distance measures: the sliced Wasserstein distance, the dimension-averaged one-dimensional Kolmogorov--Smirnov test, and the Frobenius norm of the difference between correlation matrices. Furthermore, we included estimations of the variance of both the metrics and the trained models. Our results indicate that the A-RQS algorithm stands out both in terms of accuracy and training speed. Nonetheless, all the algorithms are generally able, without too much fine-tuning, to learn complicated distributions with limited training data and in a reasonable time of the order of hours on a Tesla A40 GPU. The only exception is the C-RQS, which takes significantly longer to train, does not always provide good accuracy, and becomes unstable for large dimensionalities. All algorithms were implemented using extsc{TensorFlow2} and extsc{TensorFlow Probability} and have been made available on \href{https://github.com/NF4HEP/NormalizingFlowsHD}{GitHub}.
研究动机与目标
- 评估并比较四种归一化流架构——RealNVP、MAF、C-RQS和A-RQS——在复杂、高维、多模态目标分布上的性能。
- 通过非参数两样本检验统计量,在维度逐渐增加(4D至400D)的情况下,评估这些流的稳健性和泛化能力。
- 分析训练效率、收敛速度和模型稳定性,特别是在低数据量场景和高维设置下的表现。
- 为科学机器学习中的归一化流提供系统性基准,尤其针对高能物理和密度估计等应用。
提出的方法
- 采用四种归一化流架构:RealNVP(仿射耦合)、MAF(自回归)、C-RQS(有理二次样条耦合)和A-RQS(有理二次样条自回归)。
- 使用一组稳健的两样本检验统计量:切片Wasserstein距离、一维Kolmogorov-Smirnov检验(按维度平均)、以及相关矩阵差异的Frobenius范数。
- 在合成多变量高斯混合分布(CMoG)上训练模型,维度从4到400逐步增加,使用有限的训练数据并进行最小化超参数调优。
- 测量训练和推理时间、损失收敛情况,以及在多个随机种子下的指标方差,以评估稳定性和可复现性。
- 所有模型均使用TensorFlow 2和TensorFlow Probability实现,代码已在GitHub公开。
- 评估多次运行中的平均模型和绝对最佳模型,以区分性能趋势与异常值。
实验结果
研究问题
- RQ1仿射和有理二次样条基耦合流与自回归流在学习高维多模态分布方面表现如何比较?
- RQ2在4D至400D的维度范围内,哪种架构在使用稳健统计检验衡量下能实现最高的分布匹配准确性?
- RQ3在四种架构之间,训练速度、收敛稳定性与模型准确性的权衡关系如何?
- RQ4C-RQS架构在高维设置下是否能保持性能与稳定性,还是会出现数值问题和收敛缓慢?
- RQ5这些流在极少超参数调优和有限训练数据条件下,是否能良好泛化至复杂高维分布?
主要发现
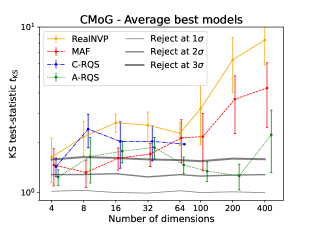
- 自回归有理二次样条(A-RQS)模型整体表现最佳,所有维度下均持续产生最低的检验统计量值,表明其在分布匹配方面具有优越性能。
- A-RQS的训练速度显著快于C-RQS,在400D时训练时间低于10,000秒,而C-RQS在400D时超过70,000秒,表明其可扩展性差。
- C-RQS在高维设置(≥200D)中表现出不稳定性,具有高方差,且频繁无法匹配目标分布,尽管使用了有理二次样条。
- MAF和RealNVP表现尚可,但在准确性和速度方面仍逊于A-RQS,尤其在超过100D时更为明显。
- 即使在极少超参数调优下,所有模型均能在Tesla A40 GPU上数小时内学习复杂分布,表明其在低数据需求下具备强大泛化能力。
- 在400D时,A-RQS实现了切片Wasserstein距离为$3.3 \times 10^{-1}$(均值)、KS检验$p$-值为$1.2 \times 10^{-1}$,以及Frobenius范数为$2.7 \times 10^{-1}$,表明其对目标分布具有极强的保真度。
更好的研究,从现在开始
从阅读论文到最终审阅,大幅缩短您的研究时间。
无需绑定信用卡
本解读由 AI 生成,并经人工编辑审核。