
[论文解读] Constraining cosmology with the Gaia-unWISE Quasar Catalog and CMB lensing: structure growth
本研究利用盖亚-未名星系巡天类星体星表(Quaia)并结合普朗克宇宙微波背景(CMB)强引力透镜图,约束宇宙学参数,测得 σ₈ = 0.766 ± 0.034 与 Ωₘ = 0.343⁺⁰.⁰¹⁷₋₀.⁰¹⁹。结果与普朗克数据在约 1.4σ 水平上一致,σ₈ 略低,主要由高红移类星体驱动,可能由于 CMB 强引力透镜图中的恒星形成背景(CIB)前景污染所致。
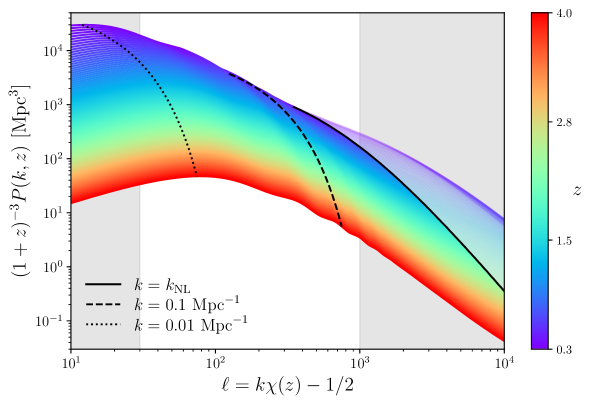
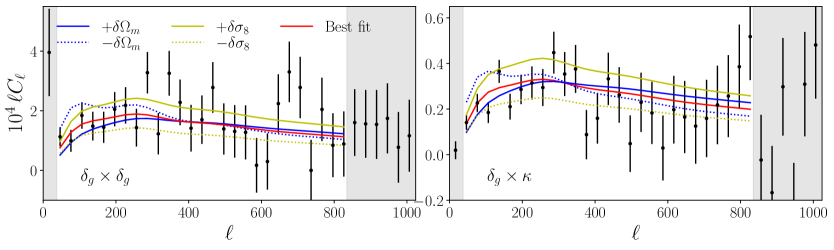
We study the angular clustering of Quaia, a Gaia- and unWISE-based catalog of over a million quasars with an exceptionally well-defined selection function. With it, we derive cosmology constraints from the amplitude and growth of structure across cosmic time. We divide the sample into two redshift bins, centered at $z=1.0$ and $z=2.1$, and measure both overdensity auto-correlations and cross-correlations with maps of the Cosmic Microwave Background convergence measured by Planck. From these data, and including a prior from measurements of the baryon acoustic oscillations scale, we place constraints on the amplitude of the matter power spectrum $σ_8=0.766\pm 0.034$, and on the matter density parameter $Ω_m=0.343^{+0.017}_{-0.019}$. These measurements are in reasonable agreement with \planck at the $\sim$ 1.4$σ$ level, and are found to be robust with respect to observational and theoretical uncertainties. We find that our slightly lower value of $σ_8$ is driven by the higher-redshift sample, which favours a low amplitude of matter fluctuations. We present plausible arguments showing that this could be driven by contamination of the CMB lensing map by high-redshift extragalactic foregrounds, which should also affect other cross-correlations with tracers of large-scale structure beyond $z\sim1.5$. Our constraints are competitive with those from state-of-the-art 3$ imes$2-point analyses, but arise from a range of scales and redshifts that is highly complementary to those covered by cosmic shear data and most galaxy clustering samples. This, coupled with the unprecedented combination of volume and redshift precision achieved by Quaia allows us to break the usual degeneracy between $Ω_m$ and $σ_8$.
研究动机与目标
- 利用 Quaia 星表中跨越宇宙时空中类星体的角功率谱约束宇宙学参数。
- 检验类星体与 CMB 强引力透镜图之间交叉相关性所导出的宇宙学约束的稳健性。
- 调查潜在系统误差,特别是 CMB 强引力透镜图中前景污染对高红移类星体交叉相关性的影响。
- 利用具有精确红移标定的高红移、大体积类星体样本,打破 Ωₘ 与 σ₈ 之间的参数退化。
提出的方法
- 将包含超过一百万个类星体且具有明确定义选源函数的 Quaia 星表,按红移分为两个区间,中心分别位于 z = 1.0 和 z = 2.1。
- 在多个角尺度上测量类星体的过密度自相关与普朗克 CMB 强引力透镜收敛图(κ)之间的交叉相关。
- 通过联合似然分析推导宇宙学约束,其中引入了重子声学振荡(BAO)尺度的先验。
- 采用数据驱动的零模型及基于 PR3 和 PR4 CMB 强引力透镜重建图(MV、Pol、TT)的蒙特卡洛模拟,检验系统偏差。
- 通过 χ² 检验评估不同强引力透镜重建方法(如 MV 与 Pol)之间功率谱密度的偏移,以判断其是否与统计涨落一致。
- 分析考虑了强引力透镜归一化校正,并利用类星体过密度图的受限高斯实现来建模信号与噪声分量。
实验结果
研究问题
- RQ1高红移类星体与 CMB 强引力透镜之间的交叉相关是否能对 σ₈ 和 Ωₘ 提供稳健约束?
- RQ2所测得的 σ₈ 与普朗克结果之间的张力是否由 CMB 强引力透镜图中的系统误差引起?
- RQ3Quaia 星表能否因其高红移精度与大体积,打破 Ωₘ 与 σ₈ 之间的退化?
- RQ4星系外前景,特别是宇宙红外背景(CIB),在 z > 1.5 时对类星体–CMB 强引力透镜交叉相关的影响有多大?
- RQ5CMB 强引力透镜重建方法之间(如 MV 与 Pol)观测到的功率谱密度差异是否与统计涨落一致,或暗示存在残余系统误差?
主要发现
- 分析结果得到 σ₈ = 0.766 ± 0.034 与 Ωₘ = 0.343⁺⁰.⁰¹⁷₋₀.⁰¹⁹,与普朗克结果在约 1.4σ 水平上一致。
- σ₈ 略低的主因是红移 ≈ 2.1 的高红移类星体样本,其偏好物质涨落功率谱振幅较低。
- 利用 PR3 与 PR4 CMB 强引力透镜图进行的一致性检验显示,整体 χ² 检验的 P 值为 6%,表明存在轻微张力,但不足以强烈否定统计涨落。
- 在 ℓ ≈ 100 与 ℓ ≈ 370 的区间,P 值约为 2%,提示可能存在不一致,或暗示存在残余系统误差。
- MV 与 Pol 强引力透镜重建方法之间观测到的带功率偏移与统计涨落一致,但 CIB 被识别为最可能影响高红移类星体–CMB 强引力透镜交叉相关的前景污染源。
- 结果对观测与理论不确定性具有鲁棒性,Quaia 样本在 3×2点分析中为宇宙弱引力透镜与星系聚类提供了高度互补的探针。
更好的研究,从现在开始
从阅读论文到最终审阅,大幅缩短您的研究时间。
无需绑定信用卡
本解读由 AI 生成,并经人工编辑审核。