
[论文解读] Data Release 3: the Solar System survey
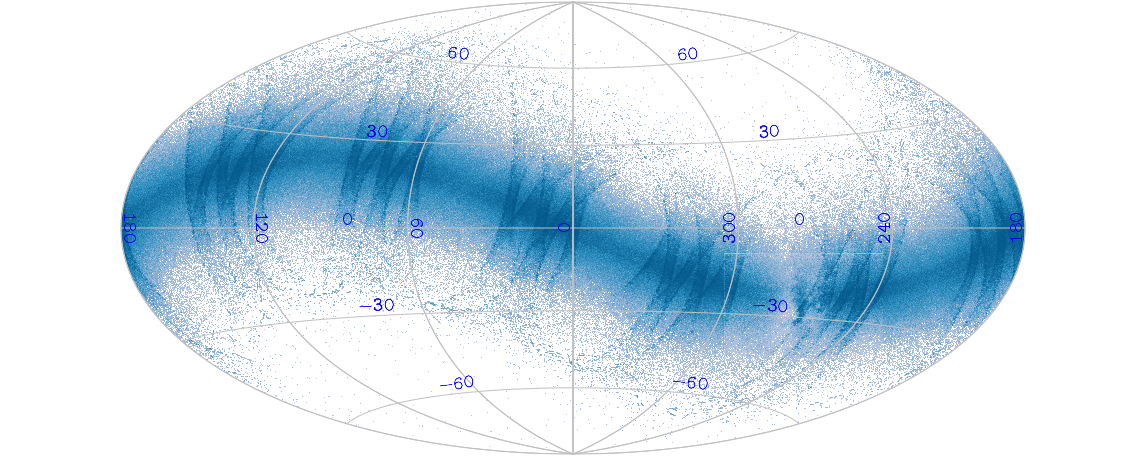
Gaia 数据释放3代(Gaia DR3)首次对超过15万个太阳系天体(包括小行星和天然卫星)进行了大规模的天体测量与光度测量调查,实现了亚毫角秒级的天体测量残差,并能够探测到由形状和卫星效应引起的毫角秒级光中心摆动。该发布展示了前所未有的轨道确定精度,并揭示了仅通过天体测量即可探测Yarkovsky漂移和双小行星系统的新能力。
The third data release by the Gaia mission of the European Space (DR3) is the first release to provide the community with a large sample of observations for more than 150 thousand Solar System objects, including asteroids and natural planetary satellites. The release contains astrometry (over 23 million epochs) and photometry, along with average reflectance spectra of 60518 asteroids and osculating elements. We present an overview of the procedures that have been implemented over several years of development and tests to process Solar System data at the level of accuracy that Gaia can reach. We illustrate the data properties and potential with some practical examples. In order to allow the users of DR3 to best exploit the data, we explain the assumptions and approaches followed in the implementation of the data processing pipeline for Solar System processing, and their effects in terms of data filtering, optimisation, and performances. We then test the data quality by analysing post-fit residuals to adjusted orbits, the capacity of detecting subtle dynamical effects (wobbling due to satellites or shape and Yarkovsky acceleration), and to reproduce known properties of asteroid photometry (phase curves and rotational light curves). The DR3 astrometric accuracy is a clear improvement over the data published in DR2, which concerned a very limited sample of asteroids. The performance of the data reduction is met, and is illustrated by the capacity of detecting milliarcsecond-level wobbling of the asteroid photocentre that is due to satellite or shape effects and contributes to Yarkovsky effect measurements. The third data release can in terms of data completeness and accuracy be considered the first full-scale realisation of the Solar System survey by Gaia.
研究动机与目标
- 为Gaia DR3中的太阳系天体开发并验证一个高精度数据处理流程。
- 实现对小行星形状和卫星运动引起的光中心摆动等微弱动力学效应的探测。
- 评估Gaia的光度测量与天体测量在小天体上的可靠性与局限性,特别是与已知物理模型的对比。
- 展示Gaia DR3在无需雷达测距的情况下,通过天体测量发现双小行星系统并测量Yarkovsky加速度的潜力。
提出的方法
- 采用全全天、多历元跟踪方法处理小行星天体测量,结合精确轨道积分与迭代优化。
- 利用低分辨率反照率光谱与G-波段星等对光度数据进行校准,并应用相位曲线与自转光曲线建模。
- 轨道拟合采用运动元素与后处理残差分析,验证天体测量精度达到毫角秒量级。
- 基于罗塞塔任务数据构建形状与散射模型,并用于模拟预期光度,实现异常值检测与质量评估。
- 对残差较大的观测实施异常值剔除,尤其针对(2867) Šteins等天体,其建模假设可能造成偏差。
- 综合采用天体测量残差、光度一致性与形状建模方法,评估数据质量并探测微弱动力学效应。
实验结果
研究问题
- RQ1Gaia DR3能否在大规模小行星样本中实现亚毫角秒级天体测量精度,以满足探测形状引起的光中心摆动的需求?
- RQ2在缺乏先前雷达测距数据的情况下,Gaia DR3在近地小行星中能多大程度探测到Yarkovsky效应?
- RQ3Gaia DR3中的G-波段光度测量对小行星的可靠性如何?由于建模限制,仍存在多少比例的异常值?
- RQ4Gaia DR3中的天体测量方法能否通过卫星引起的摆动成功探测到双小行星系统?
- RQ5基于高保真度形状模型模拟的光度能否准确再现观测到的Gaia光度?尚存哪些不确定性?
主要发现
- 对于G < 18的小行星,天体测量残差达到亚毫角秒量级,证实相比Gaia DR2有显著提升。
- 在(21) Lutetia上探测到毫角秒级的光中心摆动,表明该效应即使在较小小行星中也会影响轨道解算。
- Gaia DR3成功探测到由卫星引起的摆动,为仅通过天体测量发现双小行星系统开辟了新途径。
- 在部分近地小行星中可测量到Yarkovsky漂移,表明当结合地面跟踪数据时,Gaia具备在无雷达数据条件下探测该效应的潜力。
- 对于(2867) Šteins,G-波段星等在16.3至18.4等之间,观测误差为0.0028至0.014等,表明尽管存在建模限制,光度测量仍具有极高精度。
- 尽管精度很高,但由于形状模型与散射特性假设的限制,光度样本中仍存在不可忽视比例的异常数据。

更好的研究,从现在开始
从阅读论文到最终审阅,大幅缩短您的研究时间。
无需绑定信用卡
本解读由 AI 生成,并经人工编辑审核。