
[论文解读] Dead or Alive: Continuous Data Profiling for Interactive Data Science
本文介绍了 AutoProfiler,这是一个 Jupyter 笔记本扩展,可通过自动显示交互式可视化摘要和汇总统计信息,实现实时连续的数据分析。当数据发生变化时,这些信息会实时更新。在用户研究中,91% 的洞察是通过该工具而非手动编码发现的,表明实时与按需分析显著提升了交互式数据科学工作流中的洞察发现能力和数据质量意识。
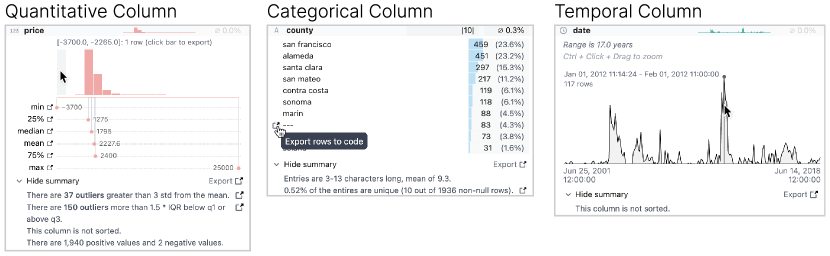
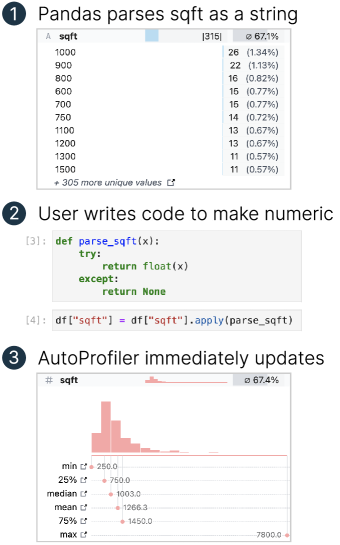
Profiling data by plotting distributions and analyzing summary statistics is a critical step throughout data analysis. Currently, this process is manual and tedious since analysts must write extra code to examine their data after every transformation. This inefficiency may lead to data scientists profiling their data infrequently, rather than after each transformation, making it easy for them to miss important errors or insights. We propose continuous data profiling as a process that allows analysts to immediately see interactive visual summaries of their data throughout their data analysis to facilitate fast and thorough analysis. Our system, AutoProfiler, presents three ways to support continuous data profiling: it automatically displays data distributions and summary statistics to facilitate data comprehension; it is live, so visualizations are always accessible and update automatically as the data updates; it supports follow up analysis and documentation by authoring code for the user in the notebook. In a user study with 16 participants, we evaluate two versions of our system that integrate different levels of automation: both automatically show data profiles and facilitate code authoring, however, one version updates reactively and the other updates only on demand. We find that both tools facilitate insight discovery with 91% of user-generated insights originating from the tools rather than manual profiling code written by users. Participants found live updates intuitive and felt it helped them verify their transformations while those with on-demand profiles liked the ability to look at past visualizations. We also present a longitudinal case study on how AutoProfiler helped domain scientists find serendipitous insights about their data through automatic, live data profiles. Our results have implications for the design of future tools that offer automated data analysis support.
研究动机与目标
- 解决交互式数据科学工作流中手动数据分析效率低下且不一致的问题。
- 通过自动化生成数据概要,减轻探索性数据分析(EDA)的认知和时间负担。
- 评估实时与按需数据分析对洞察发现和用户工作流集成的影响。
- 探索自动化工具如何支持偶然发现洞察,并通过代码导出功能促进后续分析。
提出的方法
- AutoProfiler 集成到 Jupyter 笔记本中,可在创建或更新数据框时自动显示每个数据框及其列的数据分布和汇总统计信息。
- 系统提供实时更新,确保可视化结果与内存中数据的当前状态保持一致。
- 支持按需分析作为静态内联替代方案,用于对比用户体验和性能。
- 该工具可生成可重用的代码模板,用于可视化和数据操作,使用户能够直接从界面导出并修改分析代码。
- 开展了一项纵向案例研究,观察持续分析如何在真实世界的数据科学任务中带来意外的数据质量洞察。
- 通过 16 名参与者的受控用户研究,对比了 AutoProfiler 的实时版与按需版,评估其在洞察生成和可用性方面的影响。
实验结果
研究问题
- RQ1在数据分析过程中,持续实时数据分析与按需分析相比,哪种更有利于支持洞察发现?
- RQ2自动化数据概要在多大程度上减少了对手动编写分析代码的依赖?
- RQ3用户如何评价实时与静态数据概要在交互式数据科学工作流中的可用性和价值?
- RQ4自动化数据概要工具能否促进偶然发现数据质量问题?
- RQ5代码导出功能在支持后续分析和文档记录方面的有效性如何?
主要发现
- 研究期间用户生成的 91% 洞察来自 AutoProfiler 工具,而非手动编写的分析代码。
- 使用实时版本的用户认为更新直观且有助于实时验证数据转换结果。
- 使用按需(静态)版本的用户赞赏能够回顾历史可视化并对比不同数据状态的能力。
- 纵向案例研究显示,持续分析通过自动且持续的可视化,使领域科学家发现了诸如分布平坦和异常值等意外的数据质量问题。
- 代码导出功能受到高度评价,因为它使用户能够快速调整和扩展可视化,而无需从零开始编写代码。
- 无论是实时版还是按需版,AutoProfiler 均显著降低了 EDA 所需的工作量,同时提高了发现细微数据质量问题的可能性。
更好的研究,从现在开始
从阅读论文到最终审阅,大幅缩短您的研究时间。
无需绑定信用卡
本解读由 AI 生成,并经人工编辑审核。