
[论文解读] Eigenvalue tests for the number of latent factors in short panels
本文提出基于特征值的检验方法,用于确定固定时间维度(T)和大截面规模(n)的短面板中潜在因子的数量。通过对称矩阵的扰动理论及特征值间距,该文在球形误差或工具变量假设下建立了渐近有效的检验方法,实证发现牛市和熊市中均存在5–7个潜在因子,挑战了市场下行时单一因子模型的普遍认知。
This paper studies new tests for the number of latent factors in a large cross-sectional factor model with small time dimension. These tests are based on the eigenvalues of variance-covariance matrices of (possibly weighted) asset returns, and rely on either the assumption of spherical errors, or instrumental variables for factor betas. We establish the asymptotic distributional results using expansion theorems based on perturbation theory for symmetric matrices. Our framework accommodates semi-strong factors in the systematic components. We propose a novel statistical test for weak factors against strong or semi-strong factors. We provide an empirical application to US equity data. Evidence for a different number of latent factors according to market downturns and market upturns, is statistically ambiguous in the considered subperiods. In particular, our results contradicts the common wisdom of a single factor model in bear markets.
研究动机与目标
- 解决在时间维度较小(T固定)而截面规模较大(n → ∞)的大型截面面板中识别潜在因子数量的挑战。
- 在弱、半强或强因子结构下,发展潜在因子数量的渐近有效统计检验方法。
- 通过利用有限维特征值分布,克服现有方法对大T或高斯误差假设的依赖,突破其局限性。
- 提出一种新检验统计量,基于特征值间距比,以区分弱因子与半强或强因子。
- 提供实证证据,检验因子结构在不同市场周期下的稳定性,特别是检验熊市中单一因子模型是否成立的普遍认知。
提出的方法
- 基于资产收益样本协方差矩阵的特征值与间距构造检验统计量。
- 利用对称矩阵小特征值的统一扰动展开,推导在n → ∞且T固定的渐近分布。
- 基于有限维Wishart分布与高斯矩阵特征值理论,推导渐近分布。
- 实施两种不同的识别策略:(1) 球形误差假设(用于√nS(k)),(2) 因子贝塔的工具变量法(用于nT(k))。
- 提出基于特征值间距比的新检验统计量S*(k),用于检测弱因子与半强/强因子。
- 采用p值的序列检验方法选择因子数量,确保在不同识别假设下结果的稳健性。
实验结果
研究问题
- RQ1在T固定且n较大的短面板中,样本协方差矩阵最小特征值的渐近分布为何?
- RQ2当T较小时,基于特征值的检验能否可靠检测潜在因子数量?
- RQ3所提出的检验在不同因子强度情形(弱、半强、强)下的表现如何?
- RQ4与牛市相比,市场下行期间潜在因子数量是否存在变化的实证证据?
- RQ5在严格的基于特征值的检验下,熊市中单一主导因子模型的普遍认知是否成立?
主要发现
- √nS(k)与nT(k)在所有四个子时期中结果一致,p值表明牛市与熊市中均存在5至7个潜在因子。
- 在1977/03–1978/02子时期,零因子原假设在1%水平下被拒绝(p值 < 0.01),而单因子原假设未被拒绝(p值 ≈ 0.09)。
- 特征值间距比检验S*(k)对检测少量因子的统计功效较低,尤其仅拒绝高阶原假设。
- 实证结果与普遍认知相悖:熊市中并未发现因子数量显著减少,即单一因子模型并不占主导地位。
- 潜在因子数量在不同市场周期中保持相对稳定,两种统计量在所有子时期中均选择5–7个因子。
- 基于不同识别假设(球形性 vs. 工具变量)的两种检验统计量结果高度一致,为研究发现提供了强有力的稳健性支持。
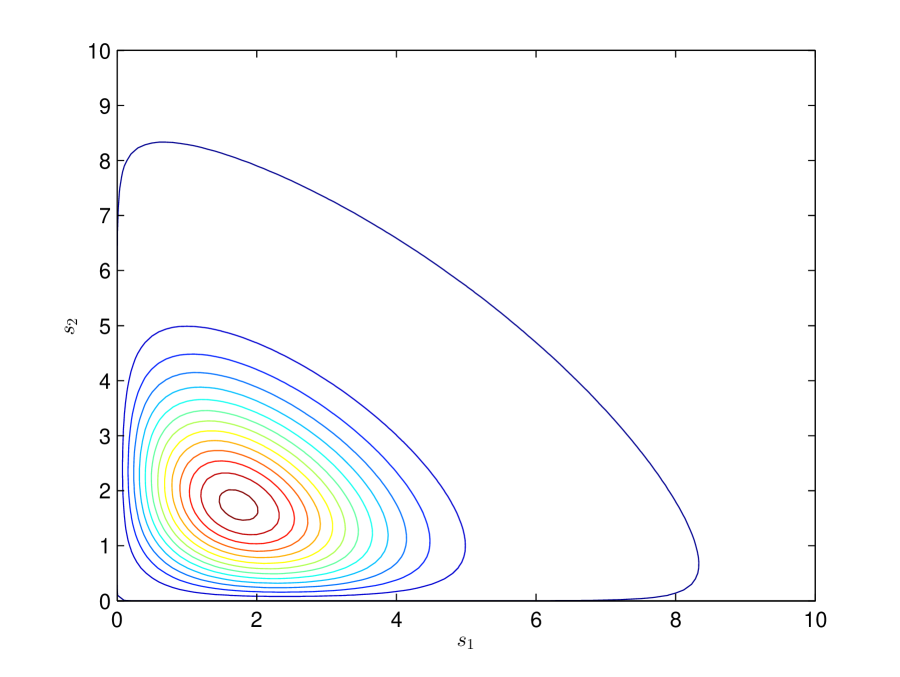
![Figure 2: The pdf $f_{3}(s)$ of eigenvalue spacing $s=\delta_{1}(Z^{*})-\delta_{3}(Z^{*})$ and the pdf $g_{3}(r)$ of eigenvalue spacings’ ratio $r=[\delta_{1}(Z^{*})-\delta_{2}(Z^{*})]/[\delta_{2}(Z^{*})-\delta_{3}(Z^{*})]$ for random matrix $Z^{*}$ in GOE( $3$ ).](https://ar5iv.labs.arxiv.org/html/2210.16042/assets/x2.png)
更好的研究,从现在开始
从阅读论文到最终审阅,大幅缩短您的研究时间。
无需绑定信用卡
本解读由 AI 生成,并经人工编辑审核。