[论文解读] Environmental Burden of United States Data Centers in the Artificial Intelligence Era
美国数据中心在过去一年排放约 105 million metric tons CO2e,碳强度约比全国平均水平高出约 48%,且化石燃料提供其电力的超过一半。
The rapid proliferation of data centers in the US - driven partly by the adoption of artificial intelligence - has set off alarm bells about the industry's environmental impact. We compiled detailed information on 2,132 US data centers operating between September 2023 and August 2024 and determined their electricity consumption, electricity sources, and attributable CO$_{2}$e emissions. Our findings reveal that data centers accounted for more than 4% of total US electricity consumption - with 56% derived from fossil fuels - generating more than 105 million tons of CO$_{2}$e (2.18% of US emissions in 2023). Data centers' carbon intensity - the amount of CO$_{2}$e emitted per unit of electricity consumed - exceeded the US average by 48%. Our data pipeline and visualization tools can be used to assess current and future environmental impacts of data centers.
研究动机与目标
- Quantify electricity consumption and its share of US total consumption for US data centers operating Sept 2023–Aug 2024.
- Identify the power plants and balancing authorities supplying data centers and attribute emissions to these sources.
- Characterize the fuel mix and carbon intensity of electricity used by data centers and compare with other sectors and countries.
- Develop a reproducible data pipeline and public web platform to monitor data center energy use and emissions for policy and mitigation.
- Provide region/state-level granularity to inform regulatory actions and interventions to reduce carbon footprint.
提出的方法
- Assembled a dataset of 2,132 US data centers operating between Sept 2023 and Aug 2024 using Baxtel data, web scraping, and OpenStreetMap validation.
- Imputed missing data center power capacities with a gradient-boosted regression tree model (GBRT) achieving R2 = 0.77.
- Assigned each data center to its balancing authority and linked to supplying power plants using EPA eGRID data for emissions accounting.
- Used a generation-weighted average attributional method to allocate each data center’s electricity demand to specific power plants and compute CO2e emissions.
- Calculated carbon intensity as CO2e per kWh and compared against US national averages and international benchmarks.
- Developed a public web platform to visualize data center energy load, emissions, and fuel mix at balancing authority, state, and county levels.]
- research_questions: ["What is the total electricity consumption of US data centers in the studied period and what share does it represent of US electricity use?","How much CO2e emissions are attributable to data centers, and how do these emissions vary by balancing authority and state?","What is the carbon intensity of electricity used by data centers, and how does it compare to the US average and international values?","What is the fuel mix powering data centers, and which regions rely most on fossil fuels (especially coal) for data center energy?","Can a reproducible data pipeline and public platform accurately track current and future environmental impacts of data centers for policy action?"]
- key_findings: ["Data centers consumed an estimated 192.64 TWh during the study period, representing about 4.59% of US total energy consumption in 2022.","Total CO2e emissions attributable to data centers were 105.59 million metric tons, about 2.18% of US emissions from energy consumption in 2022 and 1.66% of total US CO2e emissions in 2022.","Fossil fuel plants supplied more than 56% of data center electricity, with coal accounting for 16% of total energy; nuclear about 21% and renewables about 22%.","Weighted average carbon intensity for data centers was 548 g CO2e/kWh, roughly 48% higher than the US average of 369 g CO2e/kWh."," Virginia, Texas, and Oregon were leading contributors to data center emissions within the US, with significant shares in the regional emissions profile."," The authors provide a public web platform to track data center energy use and emissions by balancing authority, state, and county."]
- table_headers: []
- table_rows: []}
- title:
- tldr:
- meta_description:
- objective:
- method:
- research_questions:
- key_findings:
- table_headers:
- table_rows:

实验结果
研究问题
- RQ1What is the total electricity consumption of US data centers in the studied period and what share does it represent of US electricity use?
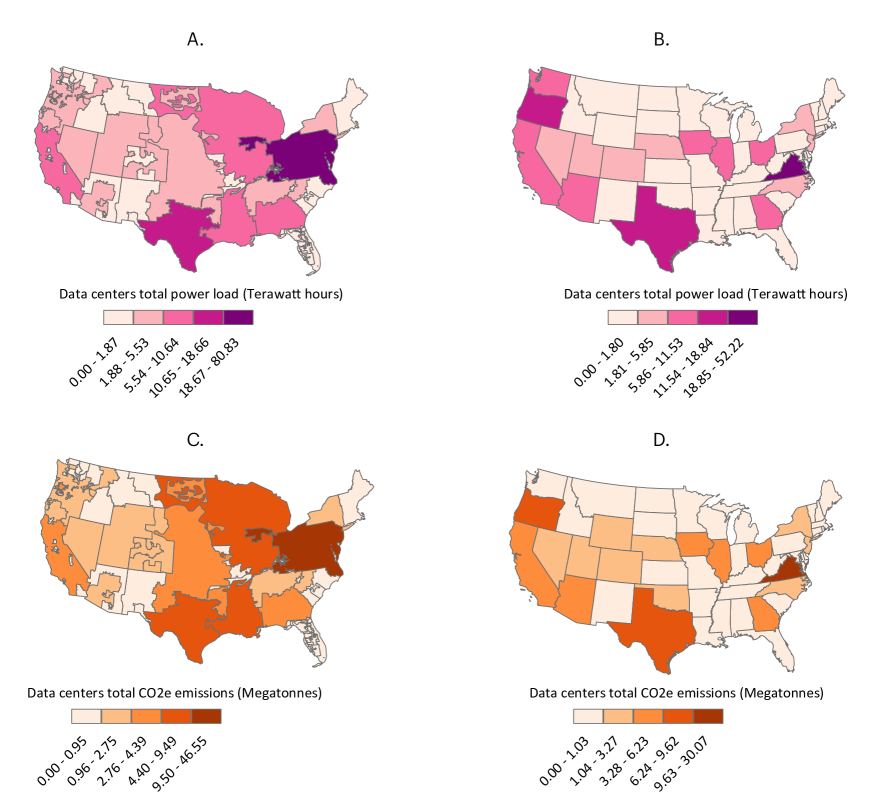
- RQ2How much CO2e emissions are attributable to data centers, and how do these emissions vary by balancing authority and state?
- RQ3What is the carbon intensity of electricity used by data centers, and how does it compare to the US average and international values?
- RQ4What is the fuel mix powering data centers, and which regions rely most on fossil fuels (especially coal) for data center energy?
- RQ5Can a reproducible data pipeline and public platform accurately track current and future environmental impacts of data centers for policy action?
主要发现
- Data centers consumed an estimated 192.64 TWh during the study period, representing about 4.59% of US total energy consumption in 2022.
- Total CO2e emissions attributable to data centers were 105.59 million metric tons, about 2.18% of US emissions from energy consumption in 2022 and 1.66% of total US CO2e emissions in 2022.
- Fossil fuel plants supplied more than 56% of data center electricity, with coal accounting for 16% of total energy; nuclear about 21% and renewables about 22%.
- Weighted average carbon intensity for data centers was 548 g CO2e/kWh, roughly 48% higher than the US average of 369 g CO2e/kWh.
- Virginia, Texas, and Oregon were leading contributors to data center emissions within the US, with significant shares in the regional emissions profile.
- The authors provide a public web platform to track data center energy use and emissions by balancing authority, state, and county.
更好的研究,从现在开始
从论文设计到论文写作,大幅缩短您的研究时间。
无需绑定信用卡
本解读由 AI 生成,并经人工编辑审核。