
[论文解读] Fascinating Supervisory Signals and Where to Find Them: Deep Anomaly Detection with Scale Learning
本文提出SLAD,一种新颖的自监督异常检测方法,适用于表格数据,通过引入'尺度'——子向量维度与表征大小之间的关系——作为数据驱动的监督信号。通过训练模型学习在不同子空间中表征的排序,结合分布对齐,SLAD捕捉到高层次的数据规律,在多种表格基准上实现最先进性能,相较于现有的生成式与对比方法,AUC-ROC显著提升。
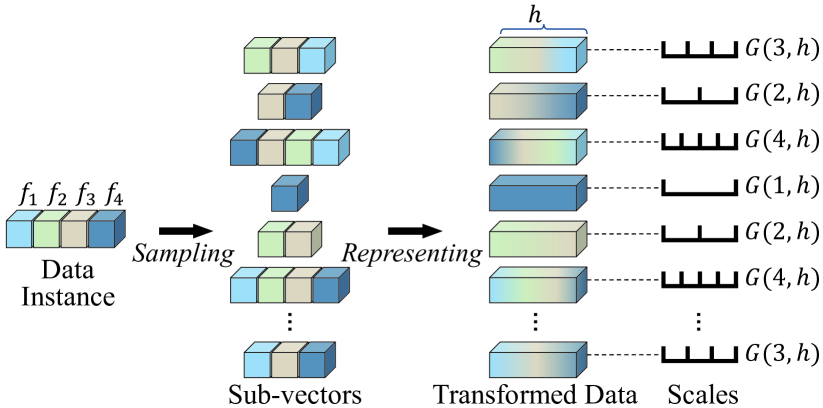
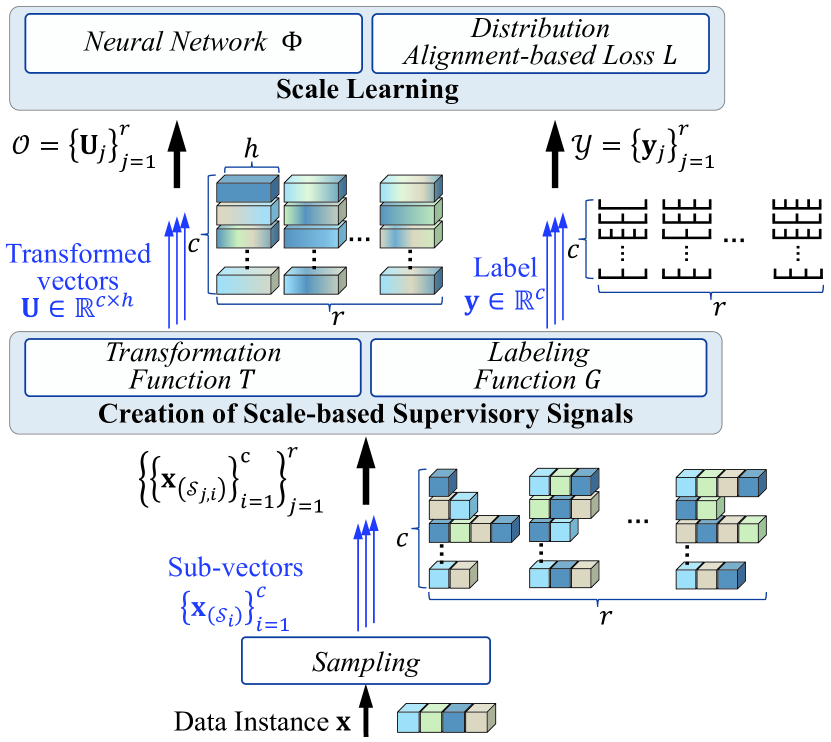
Due to the unsupervised nature of anomaly detection, the key to fueling deep models is finding supervisory signals. Different from current reconstruction-guided generative models and transformation-based contrastive models, we devise novel data-driven supervision for tabular data by introducing a characteristic -- scale -- as data labels. By representing varied sub-vectors of data instances, we define scale as the relationship between the dimensionality of original sub-vectors and that of representations. Scales serve as labels attached to transformed representations, thus offering ample labeled data for neural network training. This paper further proposes a scale learning-based anomaly detection method. Supervised by the learning objective of scale distribution alignment, our approach learns the ranking of representations converted from varied subspaces of each data instance. Through this proxy task, our approach models inherent regularities and patterns within data, which well describes data "normality". Abnormal degrees of testing instances are obtained by measuring whether they fit these learned patterns. Extensive experiments show that our approach leads to significant improvement over state-of-the-art generative/contrastive anomaly detection methods.
研究动机与目标
- 为解决在表格数据中设计有效监督信号以进行深度异常检测的挑战,其中传统的重建或对比方法适用性较低。
- 开发一种新型数据驱动监督方式,以捕捉高层次结构模式,而非低层次重建误差。
- 通过引入'尺度'作为数据表征的可学习内在特性,实现在表格数据中的自监督学习。
- 通过建模子空间间表征的相对排序来表征数据正常性,从而提升异常检测性能。
提出的方法
- 将表格数据中的'尺度'概念定义为子向量维度与其表征大小之间的数学关系。
- 通过将每个数据实例的随机子向量转换为表征,并用其对应的尺度值进行标注,构建监督信号。
- 将尺度学习定义为分布对齐任务,模型学习根据尺度对表征进行排序,重点关注相对顺序而非绝对值。
- 使用基于分布散度的损失函数,优化每个实例的子向量间预测与真实尺度分布之间的对齐。
- 采用可学习的变换函数(如随机仿射变换或MLP)从子向量生成多样化表征,并引入特征权重以突出信息丰富的特征。
- 将尺度学习作为代理任务,以学习数据规律,进而在推理阶段通过测量与学习到的模式的偏离程度来推断异常分数。
实验结果
研究问题
- RQ1尺度——即子向量维度与表征大小之间的关系——能否作为表格数据中自监督异常检测的可行监督信号?
- RQ2将尺度学习建模为分布对齐任务,相较于逐点重建或基于分类的方法,如何更有效地建模数据规律?
- RQ3所提出的方法是否在多样化的表格基准上优于最先进生成式与对比式异常检测模型?
- RQ4在表征学习过程中,该方法对噪声或无关子向量的鲁棒性如何?
主要发现
- SLAD在10个多样化的表格数据集上达到最先进性能,显著优于现有生成式与对比式方法。
- 在Thyroid数据集上,SLAD的AUC-ROC达到0.995,相较于无特征权重的消融实验提升4.7%。
- 使用均方误差损失(w/ L_mse)的性能优于交叉熵损失(w/ L_ce),表明定量尺度标签比定性分类更有效。
- 基于分布对齐的尺度学习方法优于典型的代理任务(如分类与对比学习),在Waveform上提升54.1%,在Thrombin上提升90.9%(相较于交叉熵消融)。
- 采用随机仿射变换(w/ T_Zero)的SLAD在大多数数据集上优于基于MLP的变换,表明简单且数据增强型变换的有效性。
- 在超高维数据(如Thrombin)上,w/ T_Zero因计算限制而失效,而SLAD通过低维特征加权仍保持强性能。
更好的研究,从现在开始
从阅读论文到最终审阅,大幅缩短您的研究时间。
无需绑定信用卡
本解读由 AI 生成,并经人工编辑审核。