
[论文解读] Future changes in the vertical structure of severe convective storm environments over the U.S. central Great Plains
本研究探讨了气候变化将如何改变美国中部大平原地区强雷暴环境的完整垂直结构,重点关注在固定高CAPE和高切变条件下的热力学与动力学廓线。尽管边界层水汽和自由大气直减率变化较小,但低层风切变和风暴相对螺旋度的增加表明龙卷风潜在风险上升,尽管夹卷效应和更高的LCL可能抵消这些趋势。
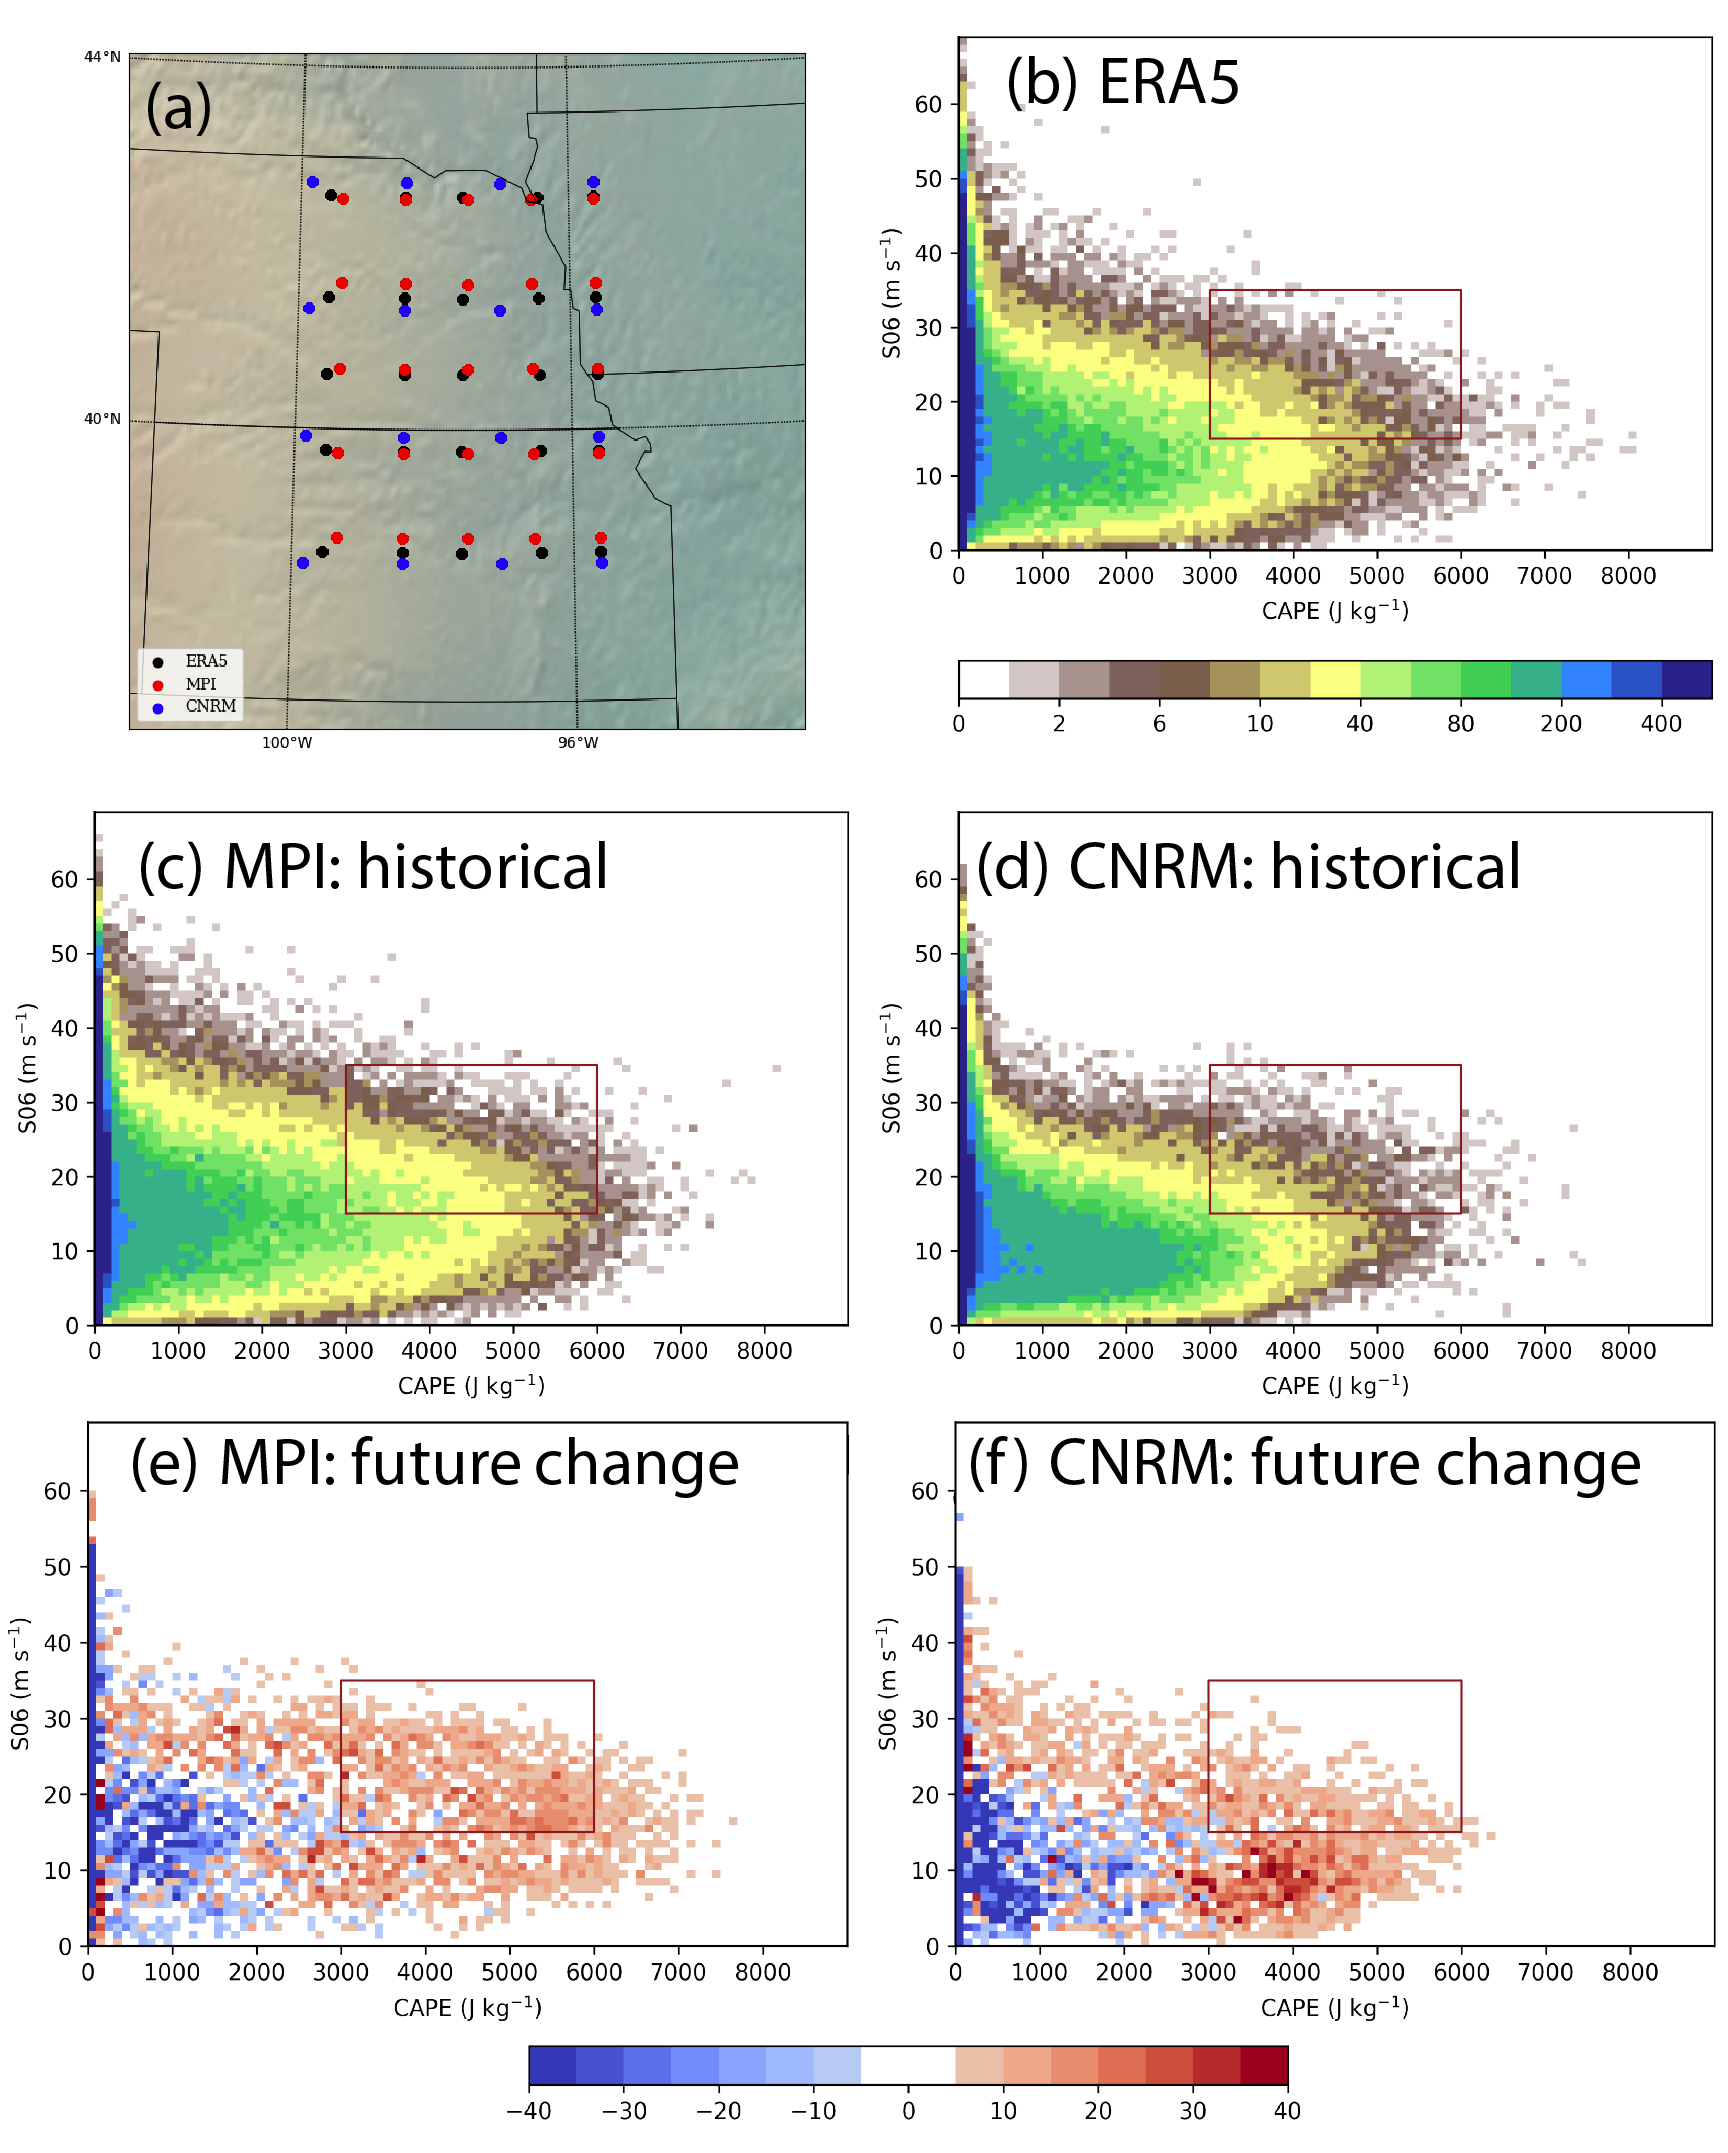
The effect of warming on severe convective storm potential is commonly explained in terms of changes in vertically-integrated ("bulk") environmental parameters, such as CAPE and 0--6 km shear. However, such events are known to depend on details of the vertical structure of the thermodynamic and kinematic environment that can change independently of these bulk parameters. This work examines how warming may affect the complete vertical structure of these environments for fixed ranges of values of high CAPE and bulk shear, using data over the central Great Plains from two high-performing climate models. Temperature profiles warm relatively uniformly with height, with a slight decrease in free tropospheric lapse rate, and the tropopause shifts upwards at constant temperature. The boundary layer becomes slightly drier (-2--4\% relative humidity) while the free troposphere becomes slightly moister (+2--3\%). Moist static energy (MSE) increases relatively uniformly with height with slightly larger increase within the boundary layer. Moist static energy deficit increases slightly above 4 km altitude. Wind shear and storm-relative helicity increase within the lowest 1.5 km associated with stronger hodograph curvature. Changes are broadly consistent between the two models despite differing biases relative to ERA5. The increased low-level shear and SRH suggests an increased potential for severe thunderstorms and tornadoes, while the slight increase in free tropospheric MSE deficit (enhanced entrainment) and decrease in boundary layer relative humidity (higher LCL) may oppose these effects. Evaluation of the net response of severe convective storm outcomes cannot be ascertained here but could be explored in simulation experiments.
研究动机与目标
- 评估在气候变暖背景下,强雷暴环境的完整垂直热力学与动力学结构如何变化,且独立于CAPE和切变等整体参数。
- 评估垂直廓线细节(如直减率、水汽和风矢量图曲率)的变化是否可能使强雷暴和龙卷风风险超出仅由整体参数预测的范围。
- 检验这些变化在两种高性能气候模型中的稳健性,尽管其相对于ERA5再分析数据存在不同偏差。
- 识别可能影响龙卷生成与对流强度的关键环境变化,即使CAPE和整体切变保持不变。
提出的方法
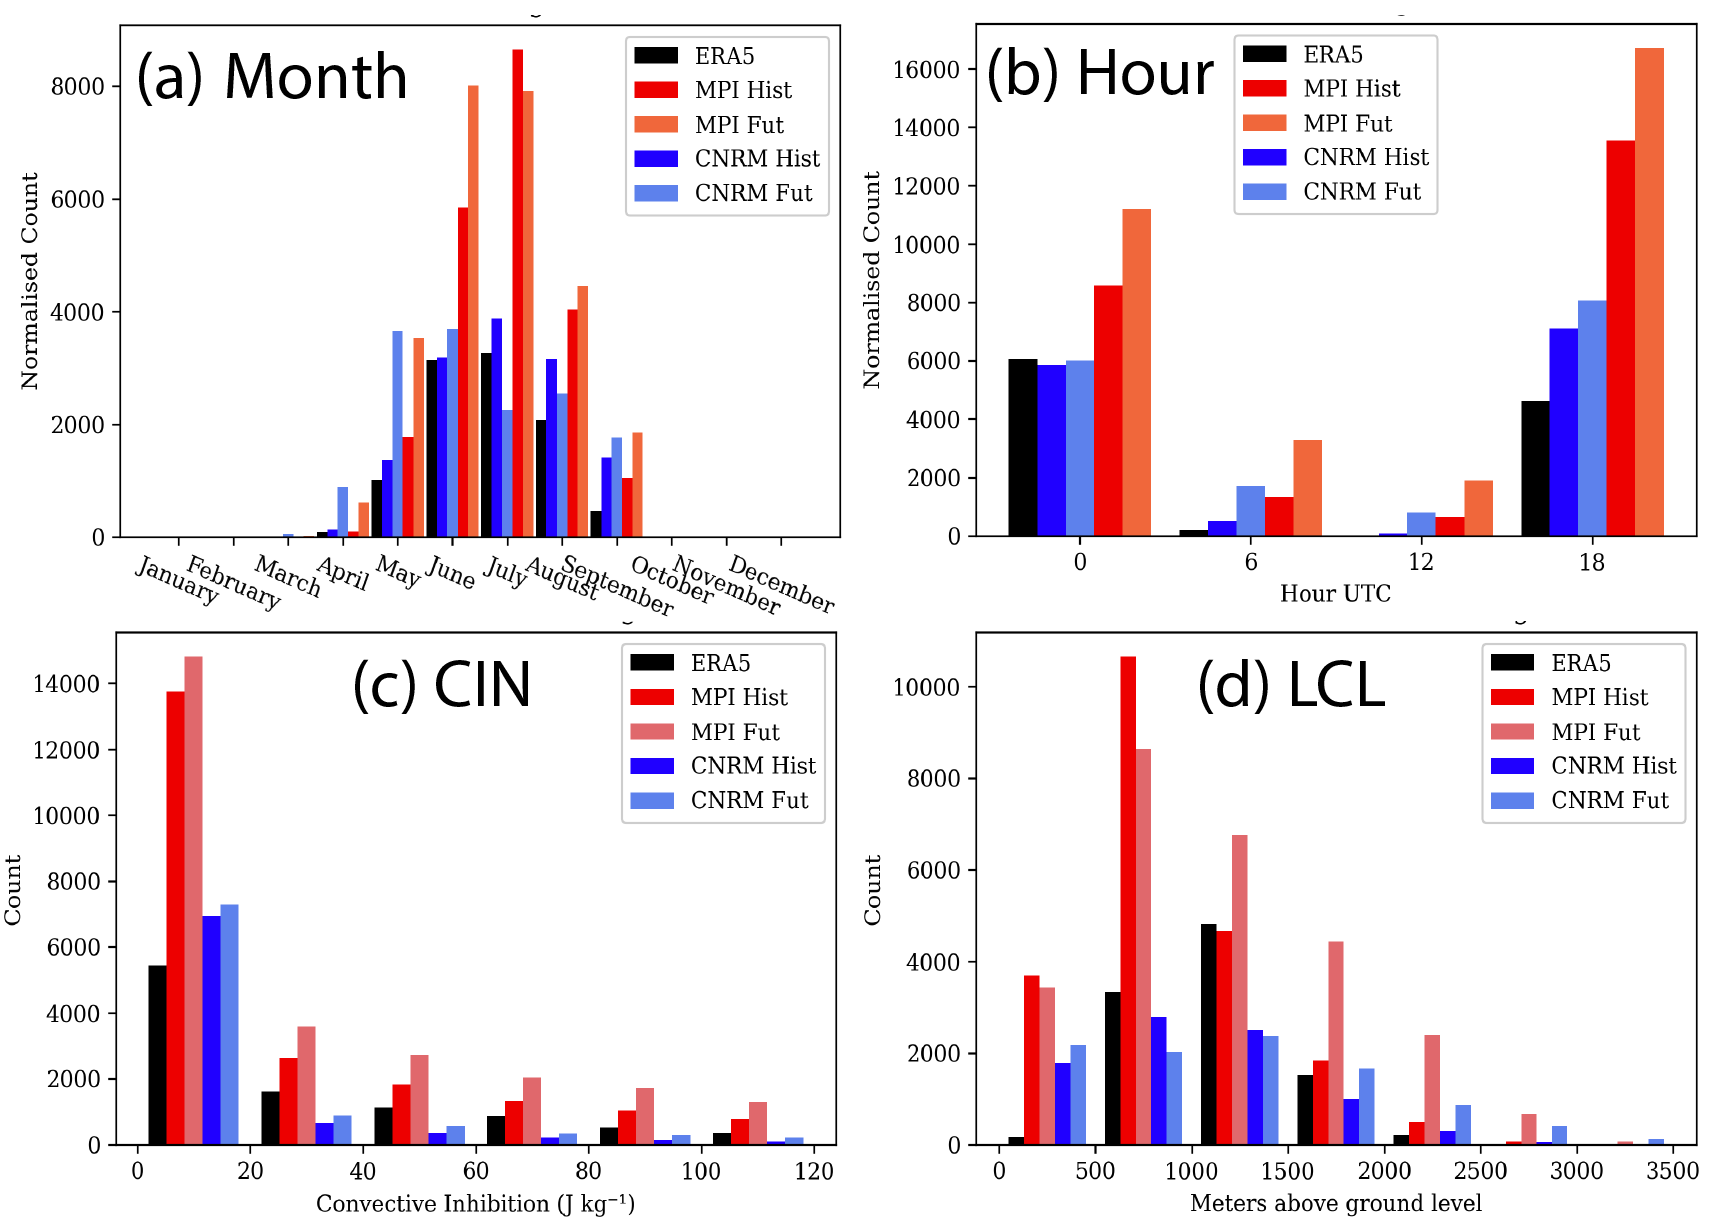
- 使用6小时一次的ERA5再分析数据和CMIP6模型输出(历史和SSP585情景)覆盖美国中部大平原地区。
- 选取固定高CAPE和高0–6公里切变(S06)的环境,以隔离与整体参数无关的垂直结构变化。
- 分析整个大气层柱的温度、水汽、风速及衍生变量(如湿位温、风暴相对螺旋度)。
- 计算关键变量的垂直廓线,包括直减率、相对湿度、湿位温(MSE)和风矢量图曲率,以评估夹卷效应和低层涡度的变化。
- 比较两种CMIP6模型(相对于ERA5存在不同偏差)的结果,以检验发现的稳健性。
- 使用统计和可视化分析(如廓线图、异常图)解释环境结构的变化。
实验结果
研究问题
- RQ1当CAPE和0–6公里切变保持不变时,气候变暖如何改变强雷暴环境的垂直热力学结构?
- RQ2低层风切变和风暴相对螺旋度发生何种变化,它们可能如何影响龙卷生成潜力?
- RQ3边界层相对湿度和自由大气直减率的变化如何影响对流触发与夹卷效应?
- RQ4在具有不同偏差的多种气候模型中,这些结构变化的预测在多大程度上具有稳健性?
- RQ5湿位温和MSE亏值的变化如何影响深厚对流和强雷暴强度的潜力?
主要发现
- 温度廓线在全层高度均匀变暖,且在恒定温度下对流层顶上升,表明对流层因热力作用而膨胀。
- 边界层相对湿度轻微下降2–4%,导致自由对流高度(LCL)升高,可能降低对流触发效率。
- 自由大气层略微增湿(相对湿度增加2–3%),同时自由大气直减率轻微减小,导致高海拔区域不稳定度降低。
- 湿位温(MSE)随高度均匀增加,且边界层增幅略大,表明对流能量供给增强。
- 由于风矢量图曲率增强,低层(1.5公里以内)风切变和风暴相对螺旋度增加,表明龙卷生成潜力提高。
- 在4公里以上自由大气层中观察到湿位温亏值轻微增加,表明夹卷与稀释效应增强,可能抑制上升气流并降低强雷暴强度。
更好的研究,从现在开始
从阅读论文到最终审阅,大幅缩短您的研究时间。
无需绑定信用卡
本解读由 AI 生成,并经人工编辑审核。