
[论文解读] GauU-Scene V2: Assessing the Reliability of Image-Based Metrics with Expansive Lidar Image Dataset Using 3DGS and NeRF
本文介绍了 GauU-Scene V2,这是一个大规模多模态数据集,结合了 6.67 km² 的无人机拍摄 RGB 图像与 627.5 亿个 LiDAR 点,可实现对 3D 场景重建的严格评估。通过使用 3D 高斯喷射(3DGS)和 NeRF,研究发现基于图像的指标(SSIM、LPIPS、PSNR)在几何评估中不可靠,因其与 Chamfer 距离等几何指标矛盾,暴露出基于 3DGS 的几何重建中的关键缺陷。
We introduce a novel, multimodal large-scale scene reconstruction benchmark that utilizes newly developed 3D representation approaches: Gaussian Splatting and Neural Radiance Fields (NeRF). Our expansive U-Scene dataset surpasses any previously existing real large-scale outdoor LiDAR and image dataset in both area and point count. GauU-Scene encompasses over 6.5 square kilometers and features a comprehensive RGB dataset coupled with LiDAR ground truth. Additionally, we are the first to propose a LiDAR and image alignment method for a drone-based dataset. Our assessment of GauU-Scene includes a detailed analysis across various novel viewpoints, employing image-based metrics such as SSIM, LPIPS, and PSNR on NeRF and Gaussian Splatting based methods. This analysis reveals contradictory results when applying geometric-based metrics like Chamfer distance. The experimental results on our multimodal dataset highlight the unreliability of current image-based metrics and reveal significant drawbacks in geometric reconstruction using the current Gaussian Splatting-based method, further illustrating the necessity of our dataset for assessing geometry reconstruction tasks. We also provide detailed supplementary information on data collection protocols and make the dataset available on the following anonymous project page
研究动机与目标
- 为解决 3D 场景重建评估中缺乏大规模、多模态且对齐的 LiDAR 与图像数据的问题。
- 调查基于图像的指标(SSIM、LPIPS、PSNR)在与 Chamfer 距离等几何指标对比时,评估 3D 重建质量的可靠性。
- 揭示并分析当前 3D 高斯喷射(3DGS)方法在几何重建中的缺陷,使用高保真、大规模基准进行分析。
- 开发并验证一种新型统计尺度匹配方法,用于将基于无人机的 LiDAR 点云与 SfM 相机位置在 WGS 84 坐标系下对齐。
- 提供一个公开可用的大规模基准数据集,以支持未来在几何重建与多模态融合方面的研究。
提出的方法
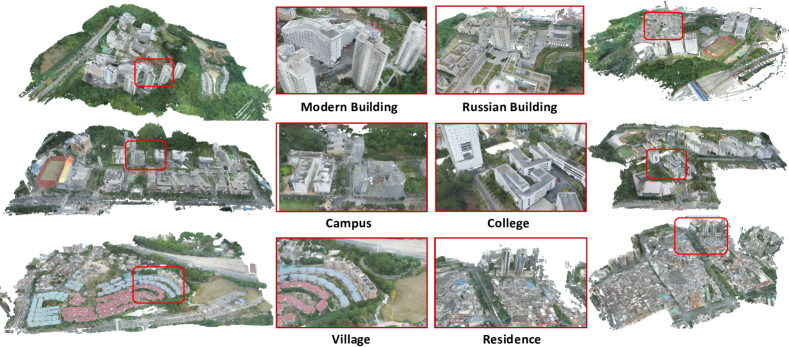
- 作者构建了 GauU-Scene V2,这是一个 6.67 km² 的室外数据集,通过搭载高分辨率 RGB 相机和高精度 LiDAR 的无人机采集,包含超过 4,600 个对齐图像和 627.5 亿个 LiDAR 点。
- 他们开发了一种统计尺度匹配方法,将 LiDAR 点云与 COLMAP 格式的 SfM 相机位置对齐,确保各模态间坐标系统的一致性。
- 该数据集支持使用基于图像和基于几何的指标,对 NeRF 和 3D 高斯喷射(3DGS)模型进行训练与评估。
- 基于图像的指标(SSIM、LPIPS、PSNR)在新视角上进行评估,而几何重建则通过预测点云与真实点云之间的 Chamfer 距离进行评估。
- 作者对 3DGS 进行了定性和定量分析,发现几乎透明的高斯喷射(alpha 值极低)是几何退化的主要原因。
- 他们进一步分析了 SuGaR 的网格输出,发现存在大量异常值,这解释了其在 Chamfer 距离上表现差但视觉质量良好的原因。

实验结果
研究问题
- RQ1当 3D 点云作为真实值时,标准基于图像的指标(SSIM、LPIPS、PSNR)在评估 3D 场景重建质量时有多可靠?
- RQ2为何 3D 高斯喷射(3DGS)方法尽管图像保真度高,却无法准确重建底层几何结构?
- RQ3几何重建指标(如 Chamfer 距离)在多大程度上与基于图像的指标在评估 3D 重建质量时产生矛盾?
- RQ4几何对齐方法(如 SuGaR)的网格输出中为何存在大量异常值,它们如何影响指标评估?
- RQ5图像采集期间光照和天气条件的变化如何影响 3DGS 中高斯喷射的定位与透明度?
主要发现
- 基于图像的指标(如 SSIM、LPIPS、PSNR)与几何指标(如 Chamfer 距离)相比时结果矛盾,表明图像保真度不能可靠反映几何精度。
- 3D 高斯喷射(3DGS)方法会产生几乎透明的高斯喷射(alpha 值极低),在 3D 空间中漂浮,导致几何重建指标下降,尽管其对可见渲染的贡献极小。
- 即使移除几乎透明的喷射,图像质量也基本保持不变,表明这些喷射是损害几何评估但未提升视觉输出的伪影。
- SuGaR 是一种专为几何对齐设计的方法,尽管其重建结果视觉上合理,但在 Chamfer 距离上排名最后,原因是其网格中存在大量异常值。
- 本研究揭示,当使用简单的点对应关系(如 3DGS 的均值)时,当前的几何指标也并不可靠,表明需要更鲁棒的几何评估框架。
- GauU-Scene V2 数据集(6.67 km²,627.5 亿个 LiDAR 点)是目前公开可用的最大规模多模态数据集,用于大规模 3D 场景重建评估。
更好的研究,从现在开始
从阅读论文到最终审阅,大幅缩短您的研究时间。
无需绑定信用卡
本解读由 AI 生成,并经人工编辑审核。