
[论文解读] Improving the open cluster census. II. An all-sky cluster catalogue with Gaia DR3
本文基于盖亚DR3数据和HDBSCAN聚类算法,提出了迄今最大的全天球星团目录,共检测到7,167个星团,其中包括2,387个新候选体。通过光度颜色-星等图和贝叶斯分类方法对星团进行验证,推断其自行、年龄、消光和距离等天体物理参数,同时发现许多文献中记载的星团可能因在盖亚数据中未能被检测到而极有可能并非真实存在。
Data from the Gaia satellite are revolutionising our understanding of the Milky Way. With every new data release, there is a need to update the census of open clusters. We aim to conduct a blind, all-sky search for open clusters using 729 million sources from Gaia DR3 down to magnitude $G\sim20$, creating a homogeneous catalogue of clusters including many new objects. We used the Hierarchical Density-Based Spatial Clustering of Applications with Noise (HDBSCAN) algorithm to recover clusters. We validated our clusters using a statistical density test and a Bayesian convolutional neural network for colour-magnitude diagram classification. We inferred basic astrometric parameters, ages, extinctions, and distances for the clusters in the catalogue. We recovered 7167 clusters, 2387 of which are candidate new objects and 4782 of which crossmatch to objects in the literature, including 134 globular clusters. A more stringent cut of our catalogue contains 4105 highly reliable clusters, 739 of which are new. Owing to the scope of our methodology, we are able to tentatively suggest that many of the clusters we are unable to detect may not be real, including 1152 clusters from the Milky Way Star Cluster (MWSC) catalogue that should have been detectable in Gaia data. Our cluster membership lists include many new members and often include tidal tails. Our catalogue's distribution traces the galactic warp, the spiral arm structure, and the dust distribution of the Milky Way. While much of the content of our catalogue contains bound open and globular clusters, as many as a few thousand of our clusters are more compatible with unbound moving groups, which we will classify in an upcoming work. We have conducted the largest search for open clusters to date, producing a single homogeneous star cluster catalogue which we make available with this paper.
研究动机与目标
- 利用盖亚DR3的7.29亿颗恒星源(极限星等G ~ 20)开展一次盲搜,对全天球范围内的星团进行系统性搜索。
- 创建一个统一的、经过统计验证的星团目录,包含年龄、消光和距离等推断的天体物理参数。
- 通过测试其在盖亚DR3数据中的可检测性,评估先前报道的星团的可靠性。
- 通过统计和光度分析,区分束缚星团与非束缚运动群。
- 利用先进的聚类和机器学习技术,提升银河系星团普查的完整性和纯净度。
提出的方法
- 在盖亚DR3的全天球天体测量和光度数据上应用HDBSCAN算法,执行基于密度的空间聚类。
- 对盖亚源实施质量筛选,剔除不可靠测量,聚焦于高精度天体测量和光度数据。
- 通过统计密度检验验证星团候选体,评估空间过密现象的显著性。
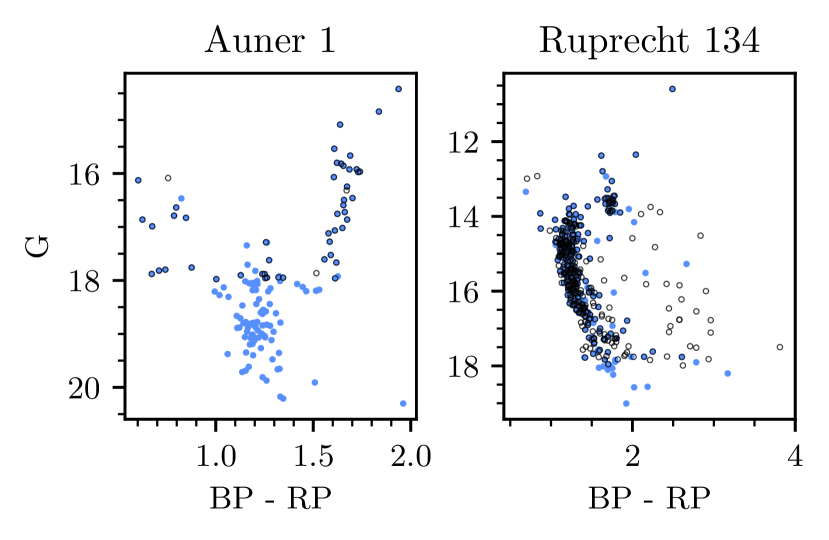
- 采用贝叶斯卷积神经网络对颜色-星等图进行分类,并为星团候选体分配可靠性评分。
- 通过贝叶斯推断拟合等值线,基于光度数据推断星团参数(年龄、消光、距离)。
- 采用多步后处理流程去除虚假信号并优化成员星列表,包括潮汐尾检测。
实验结果
研究问题
- RQ1银河系中真实存在的星团数量是多少?当前星表中尚有多少星团未被检测到?
- RQ2HDBSCAN算法是否能在整个天球范围内以高灵敏度和低误报率可靠地恢复星团?
- RQ3为何许多预盖亚星表中记载的星团在盖亚DR3数据中无法被检测到?这对其真实性意味着什么?
- RQ4所检测到的星团在多大程度上能追踪银河系的旋臂、翘曲结构和尘埃分布?
- RQ5如何利用盖亚数据和光度诊断方法,区分束缚星团与非束缚运动群?
主要发现
- 本研究共恢复7,167个星团,其中2,387个为此前文献未报道的新候选星团。
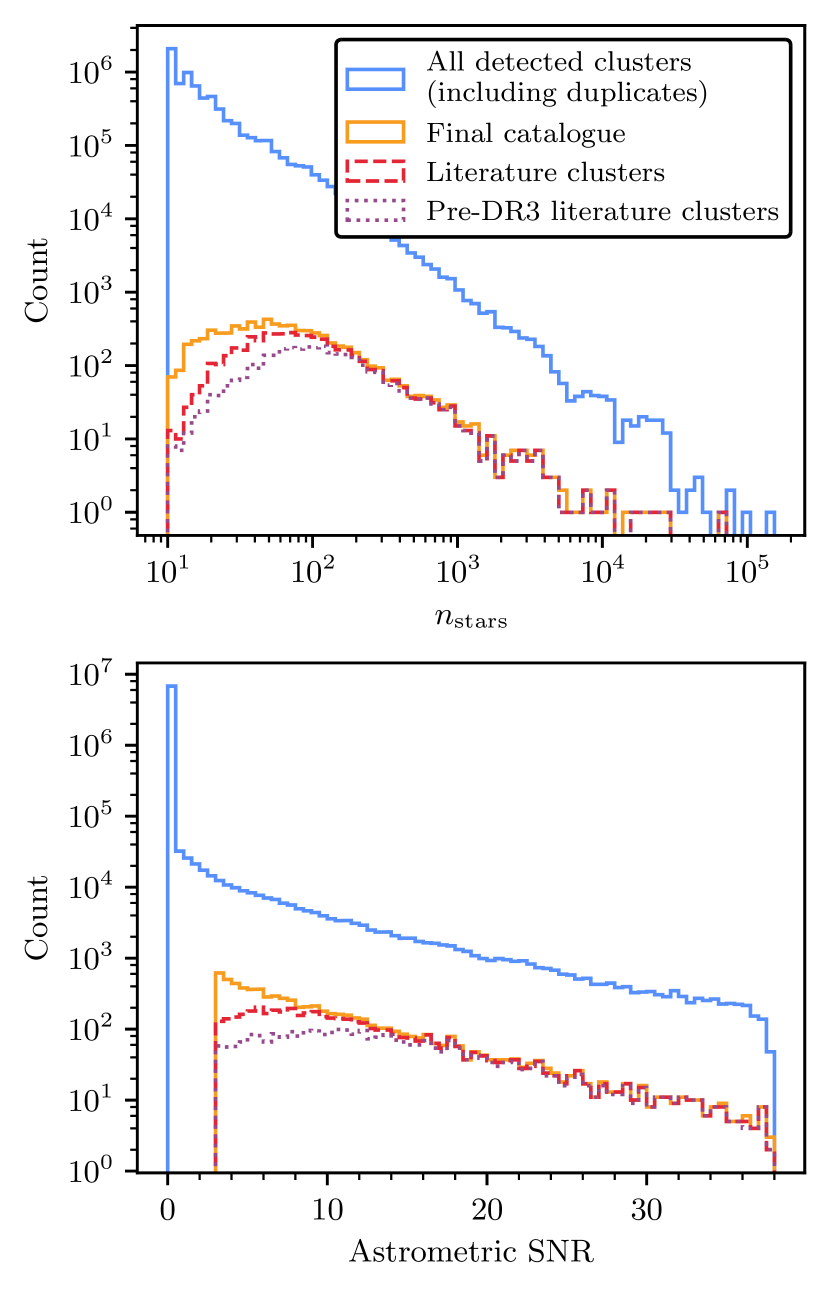
- 在与文献星表交叉匹配的4,782个星团中,有1,152个来自银河系星团目录(MWSC)的星团本应在盖亚DR3中可检测到却未被发现,暗示其可能并非真实星团。
- 识别出一个严格筛选的4,105个星团子集,其可靠性极高,其中739个为新发现,其CMD分类得分中位数 > 0.5,信噪比 > 5σ。
- 星表的空间分布和年龄分布与银河系的旋臂、银道面翘曲及尘埃结构一致,符合已知的银河系形态特征。
- 许多新检测到的星团更符合非束缚运动群而非束缚星团,表明未来需利用维里定理进行动力学分析。
- 星表表明,盖亚之前报道的许多星团可能仅为恒星星象或根本不存在,挑战了“盖亚因消光而遗漏星团”的传统假设。
更好的研究,从现在开始
从阅读论文到最终审阅,大幅缩短您的研究时间。
无需绑定信用卡
本解读由 AI 生成,并经人工编辑审核。