
[论文解读] Interpretable Survival Analysis for Heart Failure Risk Prediction
本文提出了一种新颖的、可解释的生存分析流程,用于利用电子健康记录预测心力衰竭风险。通过结合改进的生存堆叠、ControlBurn特征选择方法以及可解释提升机,该方法在保持临床可解释性的同时实现了最先进性能,并揭示了心力衰竭危险因素的新见解。
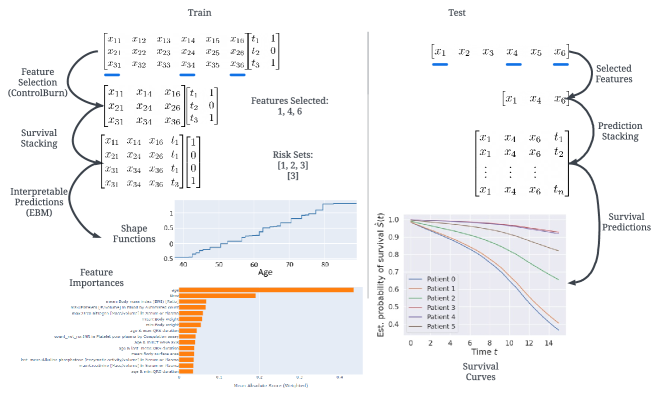
Survival analysis, or time-to-event analysis, is an important and widespread problem in healthcare research. Medical research has traditionally relied on Cox models for survival analysis, due to their simplicity and interpretability. Cox models assume a log-linear hazard function as well as proportional hazards over time, and can perform poorly when these assumptions fail. Newer survival models based on machine learning avoid these assumptions and offer improved accuracy, yet sometimes at the expense of model interpretability, which is vital for clinical use. We propose a novel survival analysis pipeline that is both interpretable and competitive with state-of-the-art survival models. Specifically, we use an improved version of survival stacking to transform a survival analysis problem to a classification problem, ControlBurn to perform feature selection, and Explainable Boosting Machines to generate interpretable predictions. To evaluate our pipeline, we predict risk of heart failure using a large-scale EHR database. Our pipeline achieves state-of-the-art performance and provides interesting and novel insights about risk factors for heart failure.
研究动机与目标
- 为解决传统Cox模型在处理生存分析中心力衰竭预测中的非比例风险和非线性效应时的局限性。
- 开发一种基于机器学习的生存分析流程,保持高度可解释性,且不依赖事后解释方法。
- 在保持临床可解释性的前提下,提升预测准确性,超越标准Cox模型,以支持真实世界医疗环境中的部署。
- 利用大规模电子健康记录数据,通过可解释建模识别心力衰竭的新型临床相关危险因素。
提出的方法
- 使用改进的、可扩展的生存堆叠版本,将生存问题转化为无需估计生存时间的二分类任务。
- 应用ControlBurn进行特征选择,通过选取相关性低的特征来减少多重共线性并提高模型稳定性。
- 采用可解释提升机(EBM)作为最终回归器,利用广义加法模型实现内在可解释的预测结果。
- 将生存数据中的风险集转换为分类任务的训练样本,保留时间至事件信息,而无需使用伪值。
- 端到端集成整个流程,以处理右删失数据,优化区分度,并确保模型透明性。
- 利用包含时间序列特征(如均值、最大值、最小值、最后一次测量值)的电子健康记录数据,捕捉纵向风险模式。
实验结果
研究问题
- RQ1是否可以设计一种生存分析流程,在实现最先进预测性能的同时,保持对临床应用的高度可解释性?
- RQ2与标准Cox模型及其他机器学习生存模型相比,所提出的流程在区分度和校准性方面表现如何?
- RQ3通过可解释模型从大规模EHR数据中识别出的新型临床心力衰竭危险因素是什么,这些因素可能被传统方法所忽视?
- RQ4通过ControlBurn进行特征选择在高维EHR数据中在多大程度上提升了模型稳定性和预测性能?
- RQ5在可扩展性和可解释性方面,无需估计生存时间的生存堆叠是否优于基于伪值的方法?
主要发现
- 所提出的流程在大规模EHR数据库上预测心力衰竭风险方面实现了最先进性能,优于标准Cox模型及其他机器学习基线模型。
- 该模型识别出以往被低估的危险因素,如体重、肌酐和QRS波持续时间的长期趋势,这些因素是心力衰竭的强预测因子。
- ControlBurn有效降低了特征相关性,提升了模型稳定性,从而获得更可靠、可解释的特征重要性排序。
- 可解释提升机提供了高保真度、局部可解释的预测结果,与临床直觉一致,有助于临床决策支持。
- 生存堆叠无需估计生存时间即可准确建模时间至事件数据,避免了伪值方法固有的偏差。
- 该流程揭示出生物标志物的动态变化——如肌酐升高和eGFR下降——所携带的预测能力,远超静态基线值。
更好的研究,从现在开始
从阅读论文到最终审阅,大幅缩短您的研究时间。
无需绑定信用卡
本解读由 AI 生成,并经人工编辑审核。