[论文解读] JADES NIRSpec Spectroscopy of GN-z11: Lyman-$α$ emission and possible enhanced nitrogen abundance in a $z=10.60$ luminous galaxy
本论文报道了 JWST/NIRSpec 光谱观测 GN-z11,确认红移 z=10.6034 并揭示 Lyman-α 发射,存在 555 km/s 偏移,同时提供详细的 rest-UV 线诊断,提示高离子化和可能的氮丰度增强。讨论源是由恒星形成还是活动性星系核(AGN)驱动,并推断物理性质,如 SFR 和金属丰度。
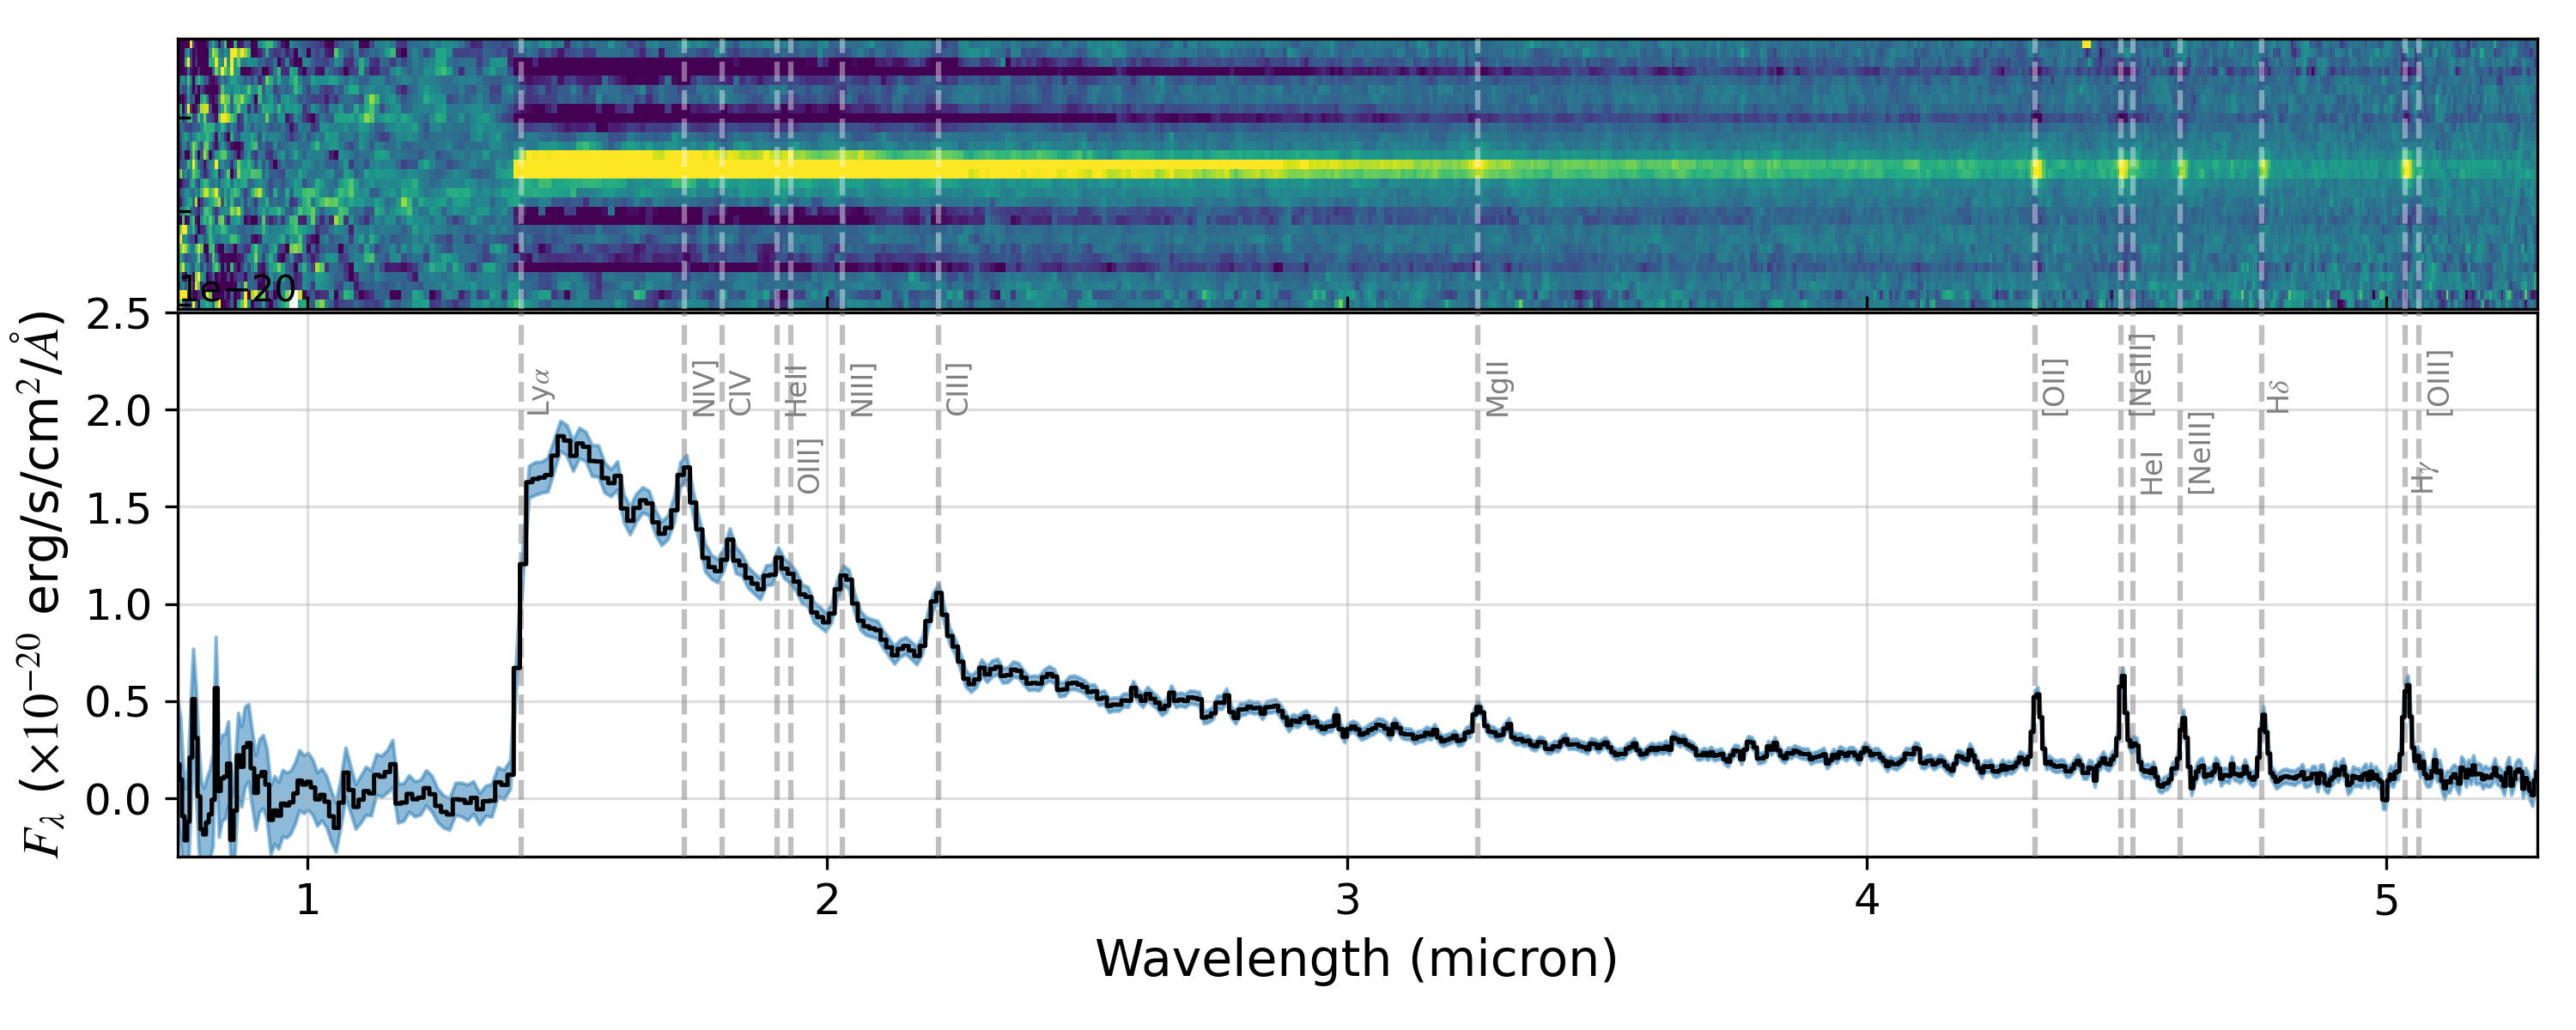
We present JADES JWST/NIRSpec spectroscopy of GN-z11, the most luminous candidate $z>10$ Lyman break galaxy in the GOODS-North field with $M_{UV}=-21.5$. We derive a redshift of $z=10.603$ (lower than previous determinations) based on multiple emission lines in our low and medium resolution spectra over $0.8-5.3 μ$m. We significantly detect the continuum and measure a blue rest-UV spectral slope of $β=-2.4$. Remarkably, we see spatially-extended Lyman-$α$ in emission (despite the highly-neutral IGM expected at this early epoch), offset 555 km s$^{-1}$ redward of the systemic redshift. From our measurements of collisionally-excited lines of both low- and high-ionization (including [O II]$\lambda3727$, [Ne III]$λ3869$ and C III]$\lambda1909$) we infer a high ionization parameter ($\log U\sim -2$). We detect the rarely-seen N IV]$\lambda1486$ and N III]$\lambda1748$ lines in both our low and medium resolution spectra, with other high ionization lines seen in the low resolution spectrum such as He II (blended with O III]) and C IV (with a possible P-Cygni profile). Based on the observed rest-UV line ratios, we cannot conclusively rule out photoionization from AGN, although the high C III]/He II and N III]/He II ratios are compatible with a star-formation explanation. If the observed emission lines are powered by star formation, then the strong N III]$\lambda1748$ observed may imply an unusually high $N/O$ abundance. Balmer emission lines (H$γ$, H$δ$) are also detected, and if powered by star formation rather than an AGN we infer a star formation rate of $\sim 20-30 M_{\odot} yr^{-1}$ (depending on the IMF) and low dust attenuation. Our NIRSpec spectroscopy confirms that GN-z11 is a remarkable galaxy with extreme properties seen 430 Myr after the Big Bang.
研究动机与目标
- 使用 JWST/NIRSpec 在 0.7–5.3 μm 范围内对 GN-z11 进行精确的光谱红移测定。
- 表征 rest-UV 和光学发射线以诊断电离源(AGN 与恒星形成)及 ISM 属性。
- 测量 Lyman-α 的性质,包括通量、EW 和空间扩展,并评估 z>10 的 IGM 透射。
- 基于线诊断和 SED 拟合推断离子化参数、金属丰度和恒星形成率等物理属性。
提出的方法
- 在 G140M、G235M、G395M 和 PRISM/CLEAR 四种配置的 MSA 模式下获取深度 JWST/NIRSpec 观测。
- 提取并校准一维/二维光谱,使用高斯轮廓拟合发射线,并在各配置之间合并结果。
- 利用线通量与比值(例如 C III]、N III]、N IV]、He II、C IV、[O II]、[Ne III])来与光致离子化模型(AGN 与恒星形成)进行比较并评估电离条件。
- 应用 BEAGLE SED 拟合整 prism 光谱以推断气相金属丰度和恒星形成属性。
- 确定 Lyman-α 属性(通量、EW、空间扩展)并测量相对于系统红移的速度偏移。
实验结果
研究问题
- RQ1通过 rest-frame 光学/UV 发射线测量,GN-z11 的精确系统红移是多少?
- RQ2rest-UV 线比和高离子化线是否更倾向于 AGN 光致离子化还是由 GN-z11 的恒星形成驱动的电离?
- RQ3Lyman-α 的性质(通量、EW、空间扩展)及其对 z>10 时 IGM 透射有何含义?
- RQ4发射线揭示了离子化参数、金属丰度以及潜在的氮丰度增强吗?
- RQ5在现有数据下,GN-z11 是否与以 AGN 为主导或以恒星形成为主导相符?
主要发现
- GN-z11 的 redshift 为 z=10.6034 ± 0.0013,基于光栅光谱中的八条清晰检测线。
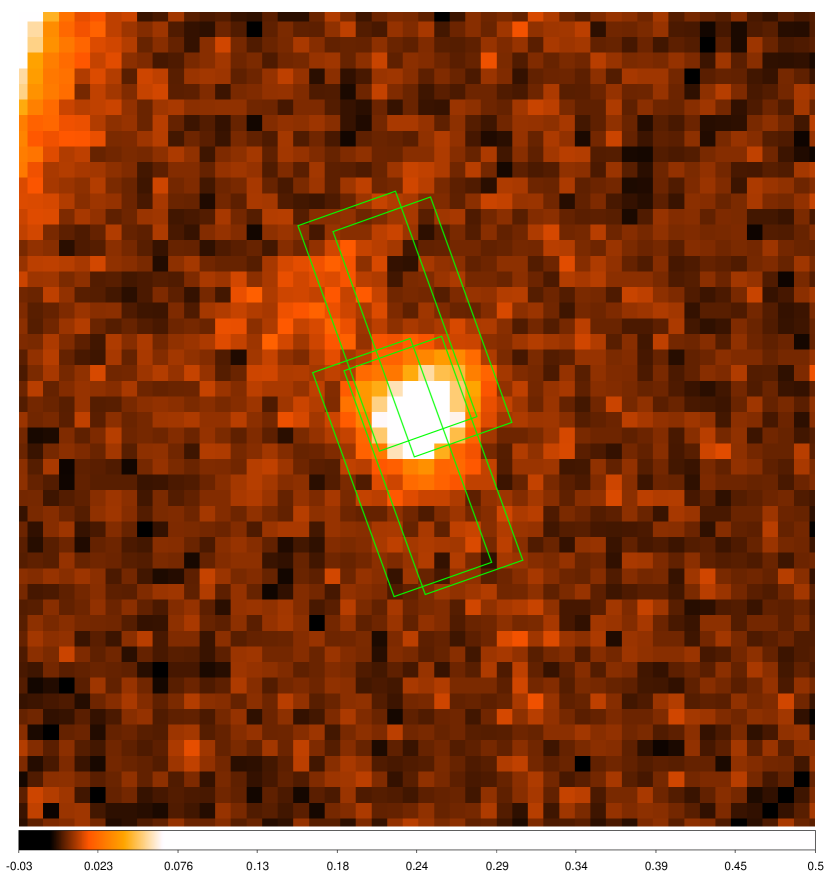
- Lyman-α 在系统红移偏移量 555 ± 32 km s−1 的红端被检测到,并显示超出连续子光谱的空间扩展。
- 检测到的线包括 N IV] 1486、N III] 1749、C III] 1907+1909、[O II] 3726,29、Ne III] 3869、Hδ、Hγ,C IV 具有 P-Cygni 偏振,He II 与 O III] 混合。
- 线比诊断将 GN-z11 置于 AGN 与恒星形成模型之间;尚未确立显著的 AGN 支配,尽管存在高离子化线。
- 若以恒星形成为动力,强的 N III] 1748 可能表示异常高的 N/O 丰度; Balmer 线暗示 SFR 约为 20–30 M⊙ yr−1(取决于初始质量函数 IMF)且尘埃衰减较低。
- 在 Case B 重组合下,Lyman-α 的逃逸分数估计为约 ≈0.038 ± 0.004,基于 Ly-α 与 Balmer 线通量。
更好的研究,从现在开始
从论文设计到论文写作,大幅缩短您的研究时间。
无需绑定信用卡
本解读由 AI 生成,并经人工编辑审核。