
[论文解读] Machine Learning for Economic Forecasting: An Application to China's GDP Growth
本论文评估了广泛的机器学习模型,以及单独与计量经济学方法结合的模型,用于预测中国季度 GDP 增长,并分析在包括拐点的时期内的可解释性与稳健性。
This paper aims to explore the application of machine learning in forecasting Chinese macroeconomic variables. Specifically, it employs various machine learning models to predict the quarterly real GDP growth of China, and analyzes the factors contributing to the performance differences among these models. Our findings indicate that the average forecast errors of machine learning models are generally lower than those of traditional econometric models or expert forecasts, particularly in periods of economic stability. However, during certain inflection points, although machine learning models still outperform traditional econometric models, expert forecasts may exhibit greater accuracy in some instances due to experts' more comprehensive understanding of the macroeconomic environment and real-time economic variables. In addition to macroeconomic forecasting, this paper employs interpretable machine learning methods to identify the key attributive variables from different machine learning models, aiming to enhance the understanding and evaluation of their contributions to macroeconomic fluctuations.
研究动机与目标
- 评估机器学习模型对中国季度 GDP 增长的预测性能,与传统计量经济模型和专家预测相比。
- 评估结合与混合建模方法,以利用 ML 与计量经济学的优点。
- 应用可解释的 ML 方法,以识别中国 GDP 波动的关键驱动因素。
- 在稳定时期与拐点(危机、COVID-19)下考察模型性能。
- 提供稳健性检验和预测准确性的时间序列分析。
提出的方法
- 将模型分为五组:计量经济学(AR、FM)、机器学习(LASSO、岭回归、KRR、RF、GBDT、XGBoost)、组合(FM+ML)、混合(组内模型的均值/中位数)、以及加权集成。
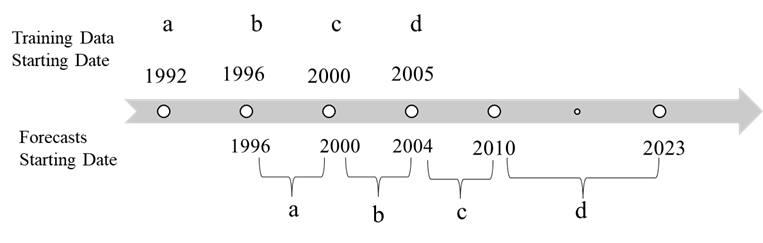
- 使用扩展窗口法(EWM)进行预测,约20个宏观变量,主要来自中国统计数据及国际对标。
- 将预测表示为 y_{t+h}=f(Z_t)+ε_{t+h},其中 Z_t 包含滞后项 y 与高维 X;通过最小化 L(y,f(Z))+R(f,ρ) 进行优化。
- 利用组合模型:通过 ML 使用 X_t 的潜在因子 F_t 进行预测 y_t+h;X_t = ΛF_t + η_t。
- 使用 SHAP 进行可解释性分析,评估全局和局部变量重要性。
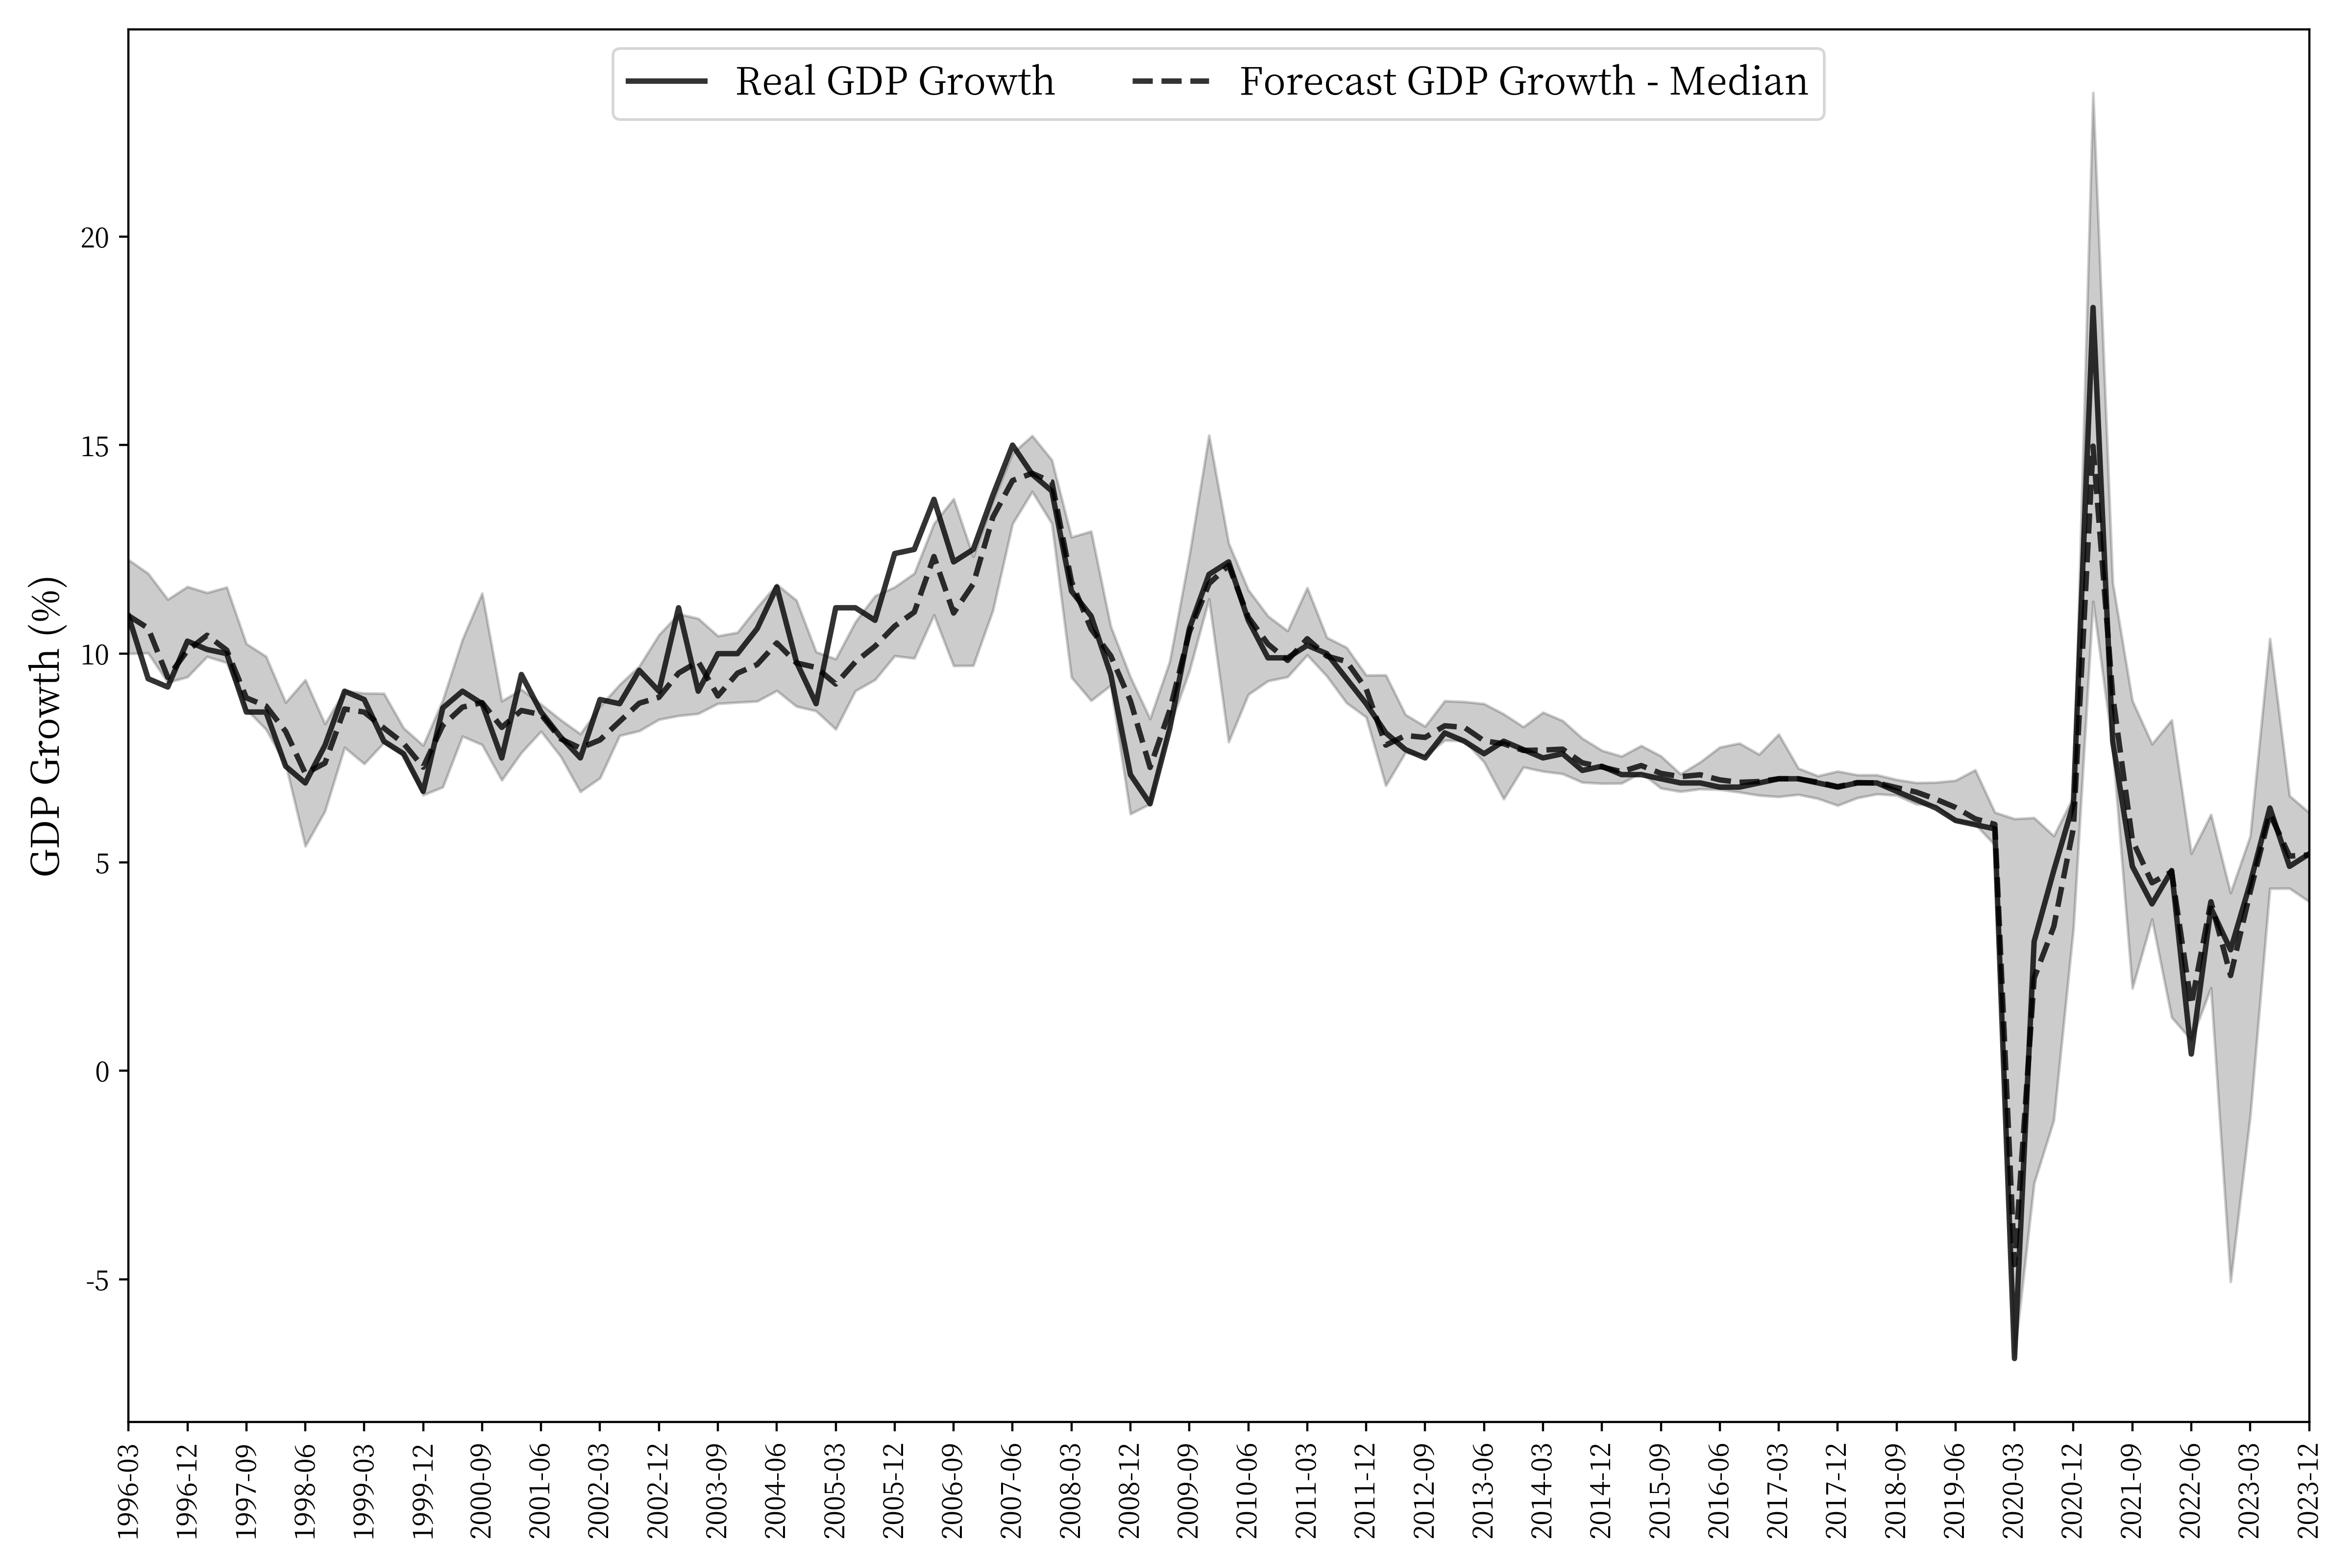
- 通过 1996Q1 至 2023Q4 的样本外预测,使用 RMSE 和 MAE;采用扩展窗口和稳健性分析。
实验结果
研究问题
- RQ1机器学习模型在单独使用或结合时,是否比传统计量经济模型和专家预测对中国 GDP 增长的预测错误更低?
- RQ2模型在稳定期与经济拐点(危机、COVID-19)期间的表现有何差异?
- RQ3根据 SHAP 解释,全球与局部对 ML 基于 GDP 预测贡献最大的变量是什么?
- RQ4组合与加权的 ML/计量经济模型在不同时间跨度上是否比单一模型预测更具稳健性?
- RQ5在2014年后期,与专家共识预测(Longrun 与 Yicai)相比,ML 集成的相对预测表现如何?
主要发现
- ML 模型及基于 ML 的混合在样本外 GDP 增长预测中通常优于传统计量经济模型。
- 在稳定时期,ML 模型与组合的预测准确性高于计量经济学和专家预测。
- 在拐点时期,ML 模型通常能预测变化方向,但在某些情况下可能因宏观经济背景的理解而被专家预测超越。
- 可解释的 ML(SHAP)揭示了跨时间的全球和局部对 GDP 波动的驱动因素重要性。
- 相比 Longrun Expert Forecasts 和其他基准,某些 ML 模型(如 RF、XGBoost)在 2005–2015 窗口内实现了更低的 RMSE;组合模型也能具竞争力,但有时落后于专家预测。
更好的研究,从现在开始
从阅读论文到最终审阅,大幅缩短您的研究时间。
无需绑定信用卡
本解读由 AI 生成,并经人工编辑审核。