
[论文解读] ManiVault: A Flexible and Extensible Visual Analytics Framework for High-Dimensional Data
ManiVault 是一个开源的、基于插件的可视化分析框架,专为高维数据探索而设计,通过模块化架构和消息传递API,支持快速原型开发和可扩展性。它支持渐进式分析、可重用的可视化与分析组件,以及通过项目状态序列化实现的完整工作流可复现性,显著降低了领域特定可视化分析应用的开发开销。
Exploration and analysis of high-dimensional data are important tasks in many fields that produce large and complex data, like the financial sector, systems biology, or cultural heritage. Tailor-made visual analytics software is developed for each specific application, limiting their applicability in other fields. However, as diverse as these fields are, their characteristics and requirements for data analysis are conceptually similar. Many applications share abstract tasks and data types and are often constructed with similar building blocks. Developing such applications, even when based mostly on existing building blocks, requires significant engineering efforts. We developed ManiVault, a flexible and extensible open-source visual analytics framework for analyzing high-dimensional data. The primary objective of ManiVault is to facilitate rapid prototyping of visual analytics workflows for visualization software developers and practitioners alike. ManiVault is built using a plugin-based architecture that offers easy extensibility. While our architecture deliberately keeps plugins self-contained, to guarantee maximum flexibility and re-usability, we have designed and implemented a messaging API for tight integration and linking of modules to support common visual analytics design patterns. We provide several visualization and analytics plugins, and ManiVault's API makes the integration of new plugins easy for developers. ManiVault facilitates the distribution of visualization and analysis pipelines and results for practitioners through saving and reproducing complete application states. As such, ManiVault can be used as a communication tool among researchers to discuss workflows and results. A copy of this paper and all supplemental material is available at https://osf.io/9k6jw and source code at https://github.com/ManiVaultStudio.
研究动机与目标
- 为解决在不同领域中开发高维数据定制化可视化分析(VA)工具时面临的高工程成本和缺乏可重用性问题。
- 使开发者和实践者能够利用可重用的可视化与分析组件,快速构建并共享交互式VA工作流。
- 提供一个模块化、可扩展的框架,支持渐进式分析,并实现新数据类型、可视化方式和算法的无缝集成。
- 通过完整项目状态序列化,支持视图、数据和参数配置的保存,促进可复现性和协作。
- 通过提供灵活且可扩展的基础架构,支持领域适配,而无需重新实现核心组件,弥合通用VA系统与领域特定需求之间的差距。
提出的方法
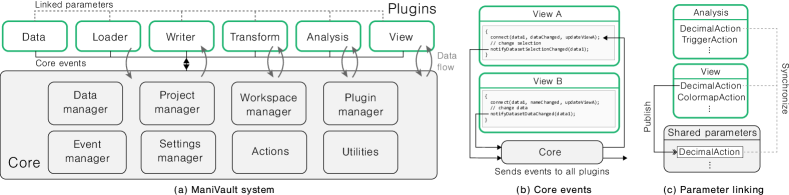
- ManiVault 采用基于插件的架构,每个插件自包含,并通过自定义消息传递API进行通信,以实现模块间的紧密集成与协调。
- 该框架采用以数据为中心的设计,支持持续的数据更新和算法引导,从而为大规模高维数据提供渐进式分析能力。
- 核心功能使用 C++ 和 Qt 实现,以支持跨平台图形用户界面,同时使用 OpenGL 实现可视化插件(如散点图和热图)的高性能渲染。
- 系统通过标准化的插件接口支持外部库和工具的集成,允许重用现有的可视化与分析算法。
- Studio Mode 允许用户锁定并发布完整的应用布局,包括视图配置、数据链接和参数设置,以实现共享与可复现性。
- 项目状态(包括数据、视图和参数连接)可被保存和恢复,从而实现完整工作流的可复现性,并支持对结果的协作讨论。
实验结果
研究问题
- RQ1如何设计一个可视化分析框架,以支持高维数据领域特定工作流的快速原型开发?
- RQ2哪些设计模式能够实现跨多样化应用领域中可视化与分析组件的可扩展性和可重用性?
- RQ3如何在模块化框架中原生支持渐进式分析,以交互式地处理大规模复杂数据集?
- RQ4通过何种方式可以对完整应用状态(包括视图布局和参数配置)进行序列化与共享,以增强协作与可复现性?
- RQ5如何利用通用且可扩展的框架(如 ManiVault)对现有领域特定VA工具进行重构或扩展?
主要发现
- ManiVault 成功实现了使用其插件和配置系统对复杂领域特定VA应用(如用于比较单细胞RNA-seq分析的 Cytosplore Viewer)的重新实现。
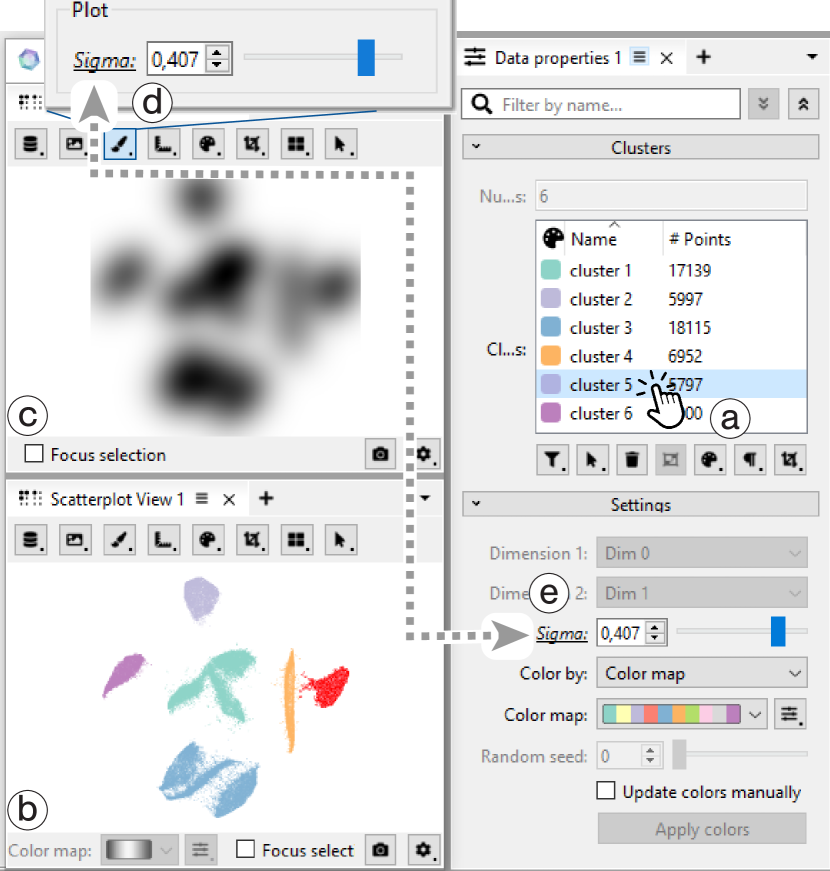
- 该框架的消息传递API实现了插件间的紧密耦合(如将表格视图的选择链接到散点图的颜色编码),而无需耦合插件代码,从而保持了模块化设计。
- 系统支持与外部工具和库的无缝集成,未来扩展还将支持Python和R分析插件,从而广泛复用数据科学流水线。
- ManiVault 的序列化机制可保存并共享完整的项目状态(包括数据、视图和参数链接),实现可复现且协作化的数据分析探索。
- 基准测试结果表明,由于其以数据为中心和模块化的设计,ManiVault 的核心架构能够高效处理数据更新并实现实时交互,即使面对大规模高维数据亦表现优异。
- 该框架已成功用于在高光谱成像和单细胞基因组学等领域构建并共享交互式可视化分析工作流,证明了其跨领域的适用性。
更好的研究,从现在开始
从阅读论文到最终审阅,大幅缩短您的研究时间。
无需绑定信用卡
本解读由 AI 生成,并经人工编辑审核。