
[论文解读] Multiple Peaks and a Long Precursor in the Type IIn Supernova 2021qqp: An Energetic Explosion in a Complex Circumstellar Environment
本研究对 Ia 型 IIn 超新星 2021qqp 进行了多波段测光与光谱观测,揭示了长达 300 天的前驱期及两个明显的光学峰值。通过光度温度曲线建模与速度演化分析,作者推断出存在一个复杂的星周介质环境,包含两次主要的质量损失事件(分别为 10 和 5 M⊙ yr⁻¹),星周介质总质量为 2–4 M⊙,超新星喷出物质量为 5–30 M⊙,爆炸能量为 (3–10)×10⁵¹ erg,表明其前身星为大质量天体,如亮蓝变星或极端恒星并合体。
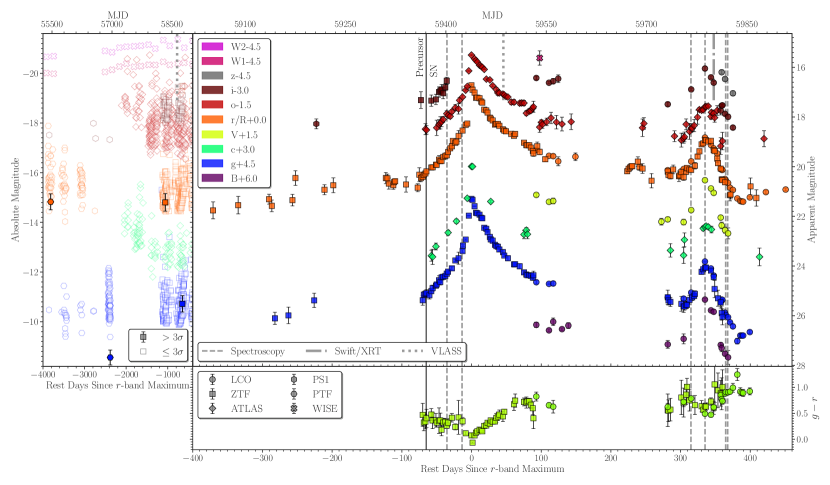
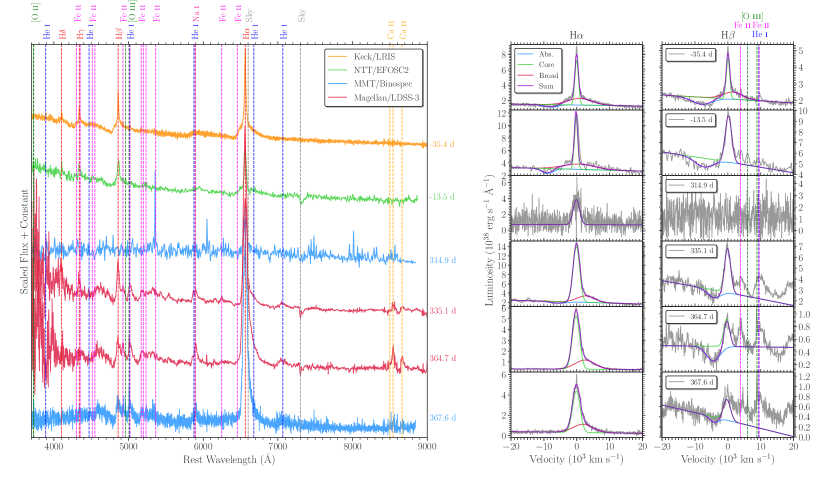
We present optical photometry and spectroscopy of the Type IIn supernova (SN) 2021qqp. Its unusual light curve is marked by a long precursor for $\approx300$ days, a rapid increase in brightness for $\approx60$ days, and then a sharp increase of $\approx1.6$ mag in only a few days to a first peak of $M_r \approx -19.5$ mag. The light curve then declines rapidly until it re-brightens to a second distinct peak of $M_r \approx -17.3$ mag centered at $\approx335$ days after the first peak. The spectra are dominated by Balmer lines with a complex morphology, including a narrow component with a width of $\approx 1300$ km s$^{-1}$ (first peak) and $\approx 2500$ km s$^{-1}$ (second peak) that we associate with the circumstellar medium (CSM) and a P Cygni component with an absorption velocity of $\approx 8500$ km s$^{-1}$ (first peak) and $\approx 5600$ km s$^{-1}$ (second peak) that we associate with the SN-CSM interaction shell. Using the luminosity and velocity evolution, we construct a flexible analytical model, finding two significant mass-loss episodes with peak mass loss rates of $\approx 10$ and $\approx 5\,M_{\odot}$ yr$^{-1}$ about $0.8$ and $2$ yr before explosion, respectively, with a total CSM mass of $\approx 2-4\,M_{\odot}$. We show that the most recent mass-loss episode could explain the precursor for the year preceding the explosion. The SN ejecta mass is constrained to be $\approx 5-30\,M_{\odot}$ for an explosion energy of $\approx (3-10) imes10^{51}$ erg. We discuss eruptive massive stars (luminous blue variable, pulsational pair instability) and an extreme stellar merger with a compact object as possible progenitor channels.
研究动机与目标
- 理解 Ia 型 IIn 超新星 2021qqp 异常光变曲线的成因,其特征为 300 天的前驱期及两个尖锐的光学峰值。
- 通过详细的测光与光谱建模,约束星周介质(CSM)及超新星爆炸的物理参数。
- 识别在复杂星周介质环境中引发高能爆炸的前身星演化通道。
- 利用光度温度曲线与速度演化分析的解析建模,确定质量损失历史与爆炸参数。
提出的方法
- 从多个天文台(包括 LCO、Keck、Magellan 和 ZTF)获取多 epoch 的光学测光与光谱数据,以追踪光变曲线与光谱演化。
- 基于多波段测光构建光度温度曲线,以估算超新星的总辐射能量与能量预算。
- 测量巴尔末线与 P Cygni 轮廓的速度演化,以追踪超新星喷出物与星周介质的相互作用,其中窄线成分指示星周介质,P Cygni 吸收深度反映激波速度。
- 开发解析模型以拟合光变曲线与速度数据,从而推导星周介质密度分布、质量损失历史及超新星爆炸参数。
- 模型假设星周介质密度分布为幂律形式,并利用能量与动量守恒推导质量损失率与星周介质总质量。
- 采用贝叶斯推断方法(使用 emcee 与 dynesty 软件包)约束所推导参数的不确定性,包括喷出物质量与爆炸能量。
实验结果
研究问题
- RQ1SN 2021qqp 中 300 天前驱光变曲线的成因是什么?其与前身星质量损失历史有何关联?
- RQ2导致多重光学峰值的星周介质(CSM)具有何种物理特性?
- RQ3SN 2021qqp 的爆炸能量与喷出物质量是多少?与典型 Ia 型 IIn 超新星相比有何差异?
- RQ4在亮蓝变星、脉动对不稳定或极端恒星并合等前身星通道中,哪一个最能解释观测到的星周介质特征与爆炸能量?
主要发现
- 该超新星表现出长达 300 天的前驱期,随后迅速上升至第一个峰值(Mr ≈ -19.5 mag),继而下降并出现第二个尖锐峰值(Mr ≈ -17.3 mag)。
- 星周介质总质量为 2–4 M⊙,包含两次主要的质量损失事件,质量损失率分别为 ≈10 M⊙ yr⁻¹ 与 ≈5 M⊙ yr⁻¹,分别发生于爆炸前 0.8 年与 2 年。
- 窄线成分的展宽从第一个峰值时的 ≈1300 km s⁻¹ 增加至第二个峰值时的 ≈2500 km s⁻¹,表明星周介质相互作用随时间演化。
- P Cygni 吸收速度从第一个峰值时的 ≈8500 km s⁻¹ 降低至第二个峰值时的 ≈5600 km s⁻¹,与星周介质中激波减速现象一致。
- 超新星喷出物质量被约束在 5–30 M⊙ 之间,爆炸能量为 (3–10)×10⁵¹ erg,表明其为一次高能爆炸。
- 最近一次质量损失事件(≈5 M⊙ yr⁻¹)足以解释前驱期现象,提示爆发前的喷发式质量损失与早期增亮存在关联。
更好的研究,从现在开始
从阅读论文到最终审阅,大幅缩短您的研究时间。
无需绑定信用卡
本解读由 AI 生成,并经人工编辑审核。