
[论文解读] MultiVision: Designing Analytical Dashboards with Deep Learning Based Recommendation
MultiVision 提出了一种基于深度学习的混合协作系统,通过评估单个图表及图表组合的质量,为分析型仪表板推荐多视图可视化。该系统利用大规模 Excel 表格数据集和溯源日志训练模型,对图表质量进行排序,显著减少了仪表板创建过程中的手动工作量,且在用户研究中优于基于规则和现有机器学习方法的推荐系统。
We contribute a deep-learning-based method that assists in designing analytical dashboards for analyzing a data table. Given a data table, data workers usually need to experience a tedious and time-consuming process to select meaningful combinations of data columns for creating charts. This process is further complicated by the need of creating dashboards composed of multiple views that unveil different perspectives of data. Existing automated approaches for recommending multiple-view visualizations mainly build on manually crafted design rules, producing sub-optimal or irrelevant suggestions. To address this gap, we present a deep learning approach for selecting data columns and recommending multiple charts. More importantly, we integrate the deep learning models into a mixed-initiative system. Our model could make recommendations given optional user-input selections of data columns. The model, in turn, learns from provenance data of authoring logs in an offline manner. We compare our deep learning model with existing methods for visualization recommendation and conduct a user study to evaluate the usefulness of the system.
研究动机与目标
- 解决分析型仪表板中数据列和图表组合选择耗时且依赖专家经验的挑战。
- 克服现有基于规则和机器学习的可视化推荐系统在仅关注单个图表或缺乏对连贯多视图设计支持方面的局限性。
- 开发一种结合深度学习模型与用户控制的混合协作系统,以平衡自动化与人类专业知识。
- 利用创作日志中的溯源数据训练模型,使其从真实世界仪表板创建模式中学习。
- 通过对比模型评估和用户研究,评估系统在推荐有效性方面的表现。
提出的方法
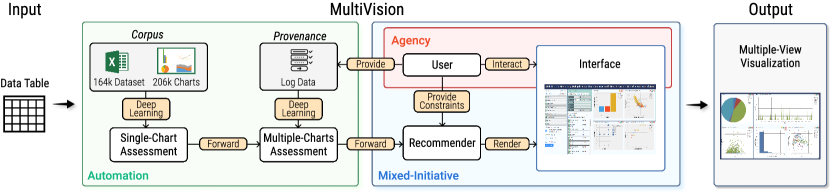
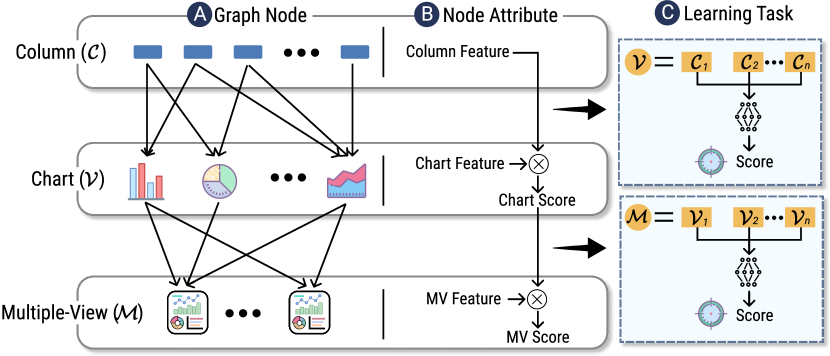
- 在包含 200,000 多个 Excel 数据表格和图表的语料库上训练深度学习模型,基于数据列选择和图表编码评估单个可视化质量。
- 设计第二个深度学习模型,从溯源数据(即用户创作日志)中学习,以推荐仪表板中多个图表的最佳组合。
- 将两个模型整合到一个混合协作的交互式系统中,用户可锁定图表、指定图表类型,并获得上下文感知的推荐。
- 采用双阶段推荐流水线:首先基于学习到的质量评分推荐单个图表;其次通过考虑图表多样性、一致性和连贯性来优化推荐结果。
- 利用用户反馈和交互日志优化推荐策略,提升系统的可用性。
- 将仪表板表示为数据列、图表和可视化语法的结构化组合,以支持基于共享、声明式表示的机器学习。
实验结果
研究问题
- RQ1深度学习模型如何有效推荐分析型仪表板中多个图表的有意义组合,而不仅限于单个图表推荐?
- RQ2与基于规则或启发式方法相比,基于真实创作日志训练的深度学习模型在多大程度上提升了推荐质量?
- RQ3将深度学习集成到混合协作系统中,如何影响用户在仪表板创建过程中的生产力和满意度?
- RQ4用户输入(如锁定的图表)在优化基于深度学习的推荐中起到什么作用?
- RQ5能否有效利用真实仪表板创作工作流中的溯源数据,训练出可泛化到新数据集的模型?
主要发现
- 在大规模 Excel 表格语料库上训练的深度学习模型,在推荐高质量单个图表方面显著优于现有的基于规则和机器学习的方法。
- 基于溯源数据训练的模型成功捕捉了用户偏好和设计模式,能够有效推荐连贯、多样且一致的多视图仪表板。
- 用户研究表明,参与者认为系统的推荐具有实用性,主动推荐虽被认为有帮助,但若时机不当可能造成干扰。
- 被动推荐策略较少被使用,表明需要更智能的交互设计,在自动化与用户控制之间取得平衡。
- 该系统表明,将深度学习与用户参与式创作相结合,可显著提升仪表板创建的效率和质量,优于完全手动或完全自动的方法。
- 目前缺乏多视图推荐的公平基线,凸显了 MultiVision 方法的创新性,也强调了在这一新兴研究领域建立标准化基准的必要性。
更好的研究,从现在开始
从阅读论文到最终审阅,大幅缩短您的研究时间。
无需绑定信用卡
本解读由 AI 生成,并经人工编辑审核。