
[论文解读] Pathways towards instability in financial networks
本文表明,市场整合与分散化——这些普遍被认为能稳定金融体系的过程——实际上可能通过在银行间网络中促进循环结构而引发不稳定性,从而放大金融压力。通过网络理论框架,本文证明:当银行间杠杆矩阵的最大特征值超过1时,无论合同细节如何,连通性和杠杆水平的提高都会导致系统不稳定。
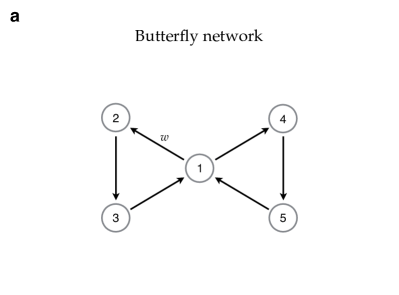
Following the financial crisis of 2007-2008, a deep analogy between the origins of instability in financial systems and complex ecosystems has been pointed out: in both cases, topological features of network structures influence how easily distress can spread within the system. However, in financial network models, the details of how financial institutions interact typically play a decisive role, and a general understanding of precisely how network topology creates instability remains lacking. Here we show how processes that are widely believed to stabilise the financial system, i.e. market integration and diversification, can actually drive it towards instability, as they contribute to create cyclical structures which tend to amplify financial distress, thereby undermining systemic stability and making large crises more likely. This result holds irrespective of the details of how institutions interact, showing that policy-relevant analysis of the factors affecting financial stability can be carried out while abstracting away from such details.
研究动机与目标
- 理解网络拓扑结构,特别是循环结构,如何导致金融网络中的系统性不稳定性。
- 探究市场整合与分散化等通常被视为稳定机制的过程,是否实际上会增加系统性风险。
- 开发一种抽象化具体合同细节、聚焦于拓扑特征的金融稳定性分析方法。
- 通过操纵网络结构并保持关键统计特性不变,识别从稳定到不稳定状态的转变路径。
- 通过将网络拓扑与不稳定性阈值关联,提供与微观金融机制无关的、具有政策参考价值的系统性风险见解。
提出的方法
- 将金融网络建模为有向加权图,以表示机构之间的银行间敞口。
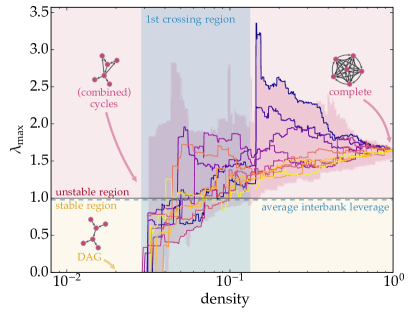
- 使用银行间杠杆矩阵的最大特征值(λ_max)作为稳定性指标:当 λ_max > 1 时,表示系统不稳定。
- 通过迭代增加或移除银行,构建合成的网络路径,同时保持平均银行间杠杆率和网络拓扑结构。
- 应用 RAS 算法对边权重进行重标度,在网络扩展或收缩过程中保持一致的杠杆水平。
- 逆转增长过程(从不稳定到稳定),以保持恒定的平均杠杆率,从而实现稳定轨迹的构建。
- 基于2012年欧洲前176家银行的资产负债表数据验证研究结果,确保实证相关性。
实验结果
研究问题
- RQ1尽管市场整合与分散化被视为稳定机制,为何它们仍会加剧系统性不稳定性?
- RQ2金融网络中的哪些拓扑特征——尤其是循环结构——会放大金融压力并导致不稳定性?
- RQ3是否可以仅通过网络层面的指标(如杠杆矩阵的最大特征值)来预测系统性不稳定性,而无需考虑合同特定的动力学?
- RQ4在保持平均杠杆率和拓扑结构不变的前提下,通过修改网络结构在多大程度上可以维持或恢复稳定性?
- RQ5从稳定到不稳定网络状态的转变路径有哪些?这些路径如何通过网络规模和连通性的渐进变化而产生?
主要发现
- 尽管市场整合与分散化具有稳定声誉,但它们可能通过增加循环性关联的可能性,推动金融网络走向不稳定性。
- 银行间杠杆矩阵的最大特征值(λ_max)是一个稳健的稳定性阈值:当 λ_max > 1 时,系统即不稳定,且与合同细节无关。
- 即使边密度保持不变,平均银行间杠杆率 >1 的稳定网络也可能因银行数量增加而变得不稳定。
- 在多种网络类型(包括Erdős-Rényi网络、规则随机网络、无标度网络和核心-外围网络)中均存在从稳定到不稳定的转变路径,表明该机制具有普遍性。
- 在2012年欧洲前176家银行的真实数据中,银行间网络被发现处于不稳定状态(λ_max > 1),表明存在系统性风险暴露。
- 本研究证实,不稳定性并非源于特定的违约机制,而是源于循环等结构性特征,因此可在不建模详细违约传播机制的前提下评估系统性风险。
更好的研究,从现在开始
从阅读论文到最终审阅,大幅缩短您的研究时间。
无需绑定信用卡
本解读由 AI 生成,并经人工编辑审核。