
[论文解读] Personalized Imputation in metric spaces via conformal prediction: Applications in Predicting Diabetes Development with Continuous Glucose Monitoring Information
该论文提出了一种新颖的两步框架,用于在度量空间中使用预测性推断对缺失的连续血糖监测(CGM)数据进行个性化填补,从而提升糖尿病发病预测的准确性。通过将血糖谱建模为2-沃瑟斯坦空间中的概率分布(糖浓度密度),并应用个性化预测性推断,该方法相比传统模型将预测准确率提高了10%以上。
The challenge of handling missing data is widespread in modern data analysis, particularly during the preprocessing phase and in various inferential modeling tasks. Although numerous algorithms exist for imputing missing data, the assessment of imputation quality at the patient level often lacks personalized statistical approaches. Moreover, there is a scarcity of imputation methods for metric space based statistical objects. The aim of this paper is to introduce a novel two-step framework that comprises: (i) a imputation methods for statistical objects taking values in metrics spaces, and (ii) a criterion for personalizing imputation using conformal inference techniques. This work is motivated by the need to impute distributional functional representations of continuous glucose monitoring (CGM) data within the context of a longitudinal study on diabetes, where a significant fraction of patients do not have available CGM profiles. The importance of these methods is illustrated by evaluating the effectiveness of CGM data as new digital biomarkers to predict the time to diabetes onset in healthy populations. To address these scientific challenges, we propose: (i) a new regression algorithm for missing responses; (ii) novel conformal prediction algorithms tailored for metric spaces with a focus on density responses within the 2-Wasserstein geometry; (iii) a broadly applicable personalized imputation method criterion, designed to enhance both of the aforementioned strategies, yet valid across any statistical model and data structure. Our findings reveal that incorporating CGM data into diabetes time-to-event analysis, augmented with a novel personalization phase of imputation, significantly enhances predictive accuracy by over ten percent compared to traditional predictive models for time to diabetes.
研究动机与目标
- 为解决生物医学研究中缺失的功能性与分布型数据缺乏个性化、统计严谨的填补方法的问题。
- 开发一种用于在度量空间中填补以概率分布形式表示的缺失连续血糖监测(CGM)谱型的方法。
- 将高分辨率的糖浓度密度数据作为数字生物标志物,用于预测非糖尿病人群中糖尿病发病时间。
- 提供一种可推广的、与模型无关的个性化填补框架,以提升纵向健康研究中的预测性能。
- 在一项真实世界纵向队列研究(AEGIS)中验证该方法,其中仅部分参与者拥有完整的CGM数据。
提出的方法
- 提出一种在度量空间中用于线性模型的加权最小二乘估计器,实现对概率分布等统计对象的回归。
- 提出一种专为度量空间设计的新型预测性推断算法,特别采用2-沃瑟斯坦距离来量化分布型响应的不确定性。
- 在有界度量空间中使用条件弗雷歇均值作为填补目标,确保在分布型数据下的一致性与鲁棒性。
- 采用基于预测性推断的个性化填补准则,自适应个体层面的不确定性,从而提升结果的可靠性与校准性。
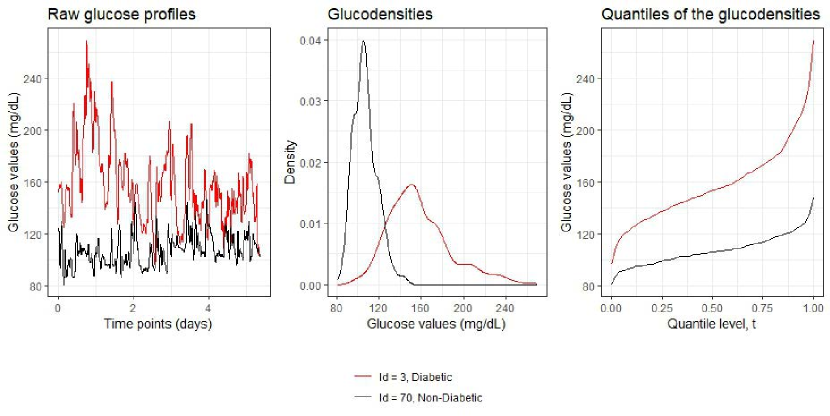
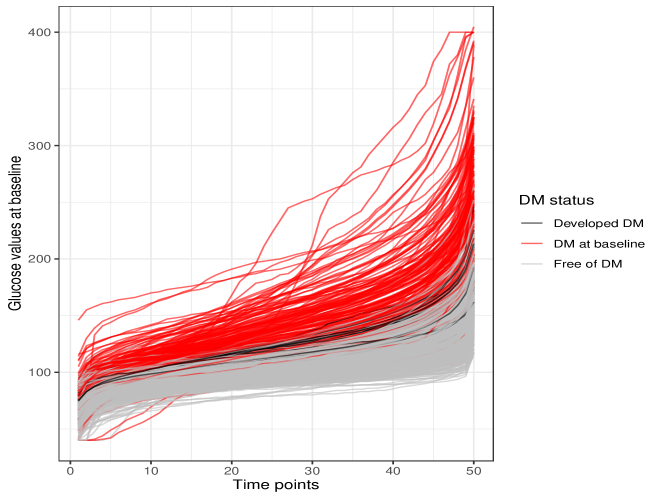
- 利用从原始CGM数据中提取的糖浓度密度表示,以捕捉完整的血糖时间动态,替代传统摘要统计量。
- 通过两步研究设计验证该方法:首先填补缺失的CGM谱型,随后使用C指数和AUC进行生存时间分析。
实验结果
研究问题
- RQ1在度量空间中对缺失的CGM数据进行个性化填补,能否提升对非糖尿病人群中糖尿病发病时间的预测能力?
- RQ2与传统生物标志物相比,将血糖谱型的分布表示(糖浓度密度)纳入分析,能否显著提升预测性能?
- RQ3在2-沃瑟斯坦空间中使用预测性推断,能否显著提升填补的分布型响应的可靠性与校准性?
- RQ4能否开发一种通用的、与模型无关的填补准则,以在多种数据结构与统计模型中提升预测准确性?
- RQ5个性化不确定性量化对基于高分辨率血糖数据的时间-事件预测模型的C指数与AUC有何影响?
主要发现
- 与仅依赖标量生物标志物的传统模型相比,所提出的方法使糖尿病发病时间预测的准确率提高了10%以上。
- 个性化预测性推断框架在半径为110时达到C指数0.90,覆盖62名接受填补的受试者,表明其具有出色的校准性与覆盖率。
- 随时间推移的曲线下面积(AUC)持续高于传统CGM风险评估,表明其具备更优的动态预测性能。
- 带有预测带的条件弗雷歇均值能有效捕捉个体化的血糖动态,且在预测性推断框架中,随着半径增大,不确定性也随之增加。
- 即使在队列中仅580名(共1,516名)参与者拥有完整CGM数据的情况下,该方法仍显著提升了模型性能,验证了其在成本受限的纵向研究中的实用性。
- 纳入个性化填补CGM数据的模型C评分达到0.805,显著优于未使用功能型数据的模型。
更好的研究,从现在开始
从阅读论文到最终审阅,大幅缩短您的研究时间。
无需绑定信用卡
本解读由 AI 生成,并经人工编辑审核。