
[论文解读] Picturing global substorm dynamics in the magnetotail using low-altitude ELFIN measurements and data mining-based magnetic field reconstructions
本研究将低空 ELFIN 卫星对高能粒子沉降的测量与基于数据挖掘的磁场重构方法(SST19)相结合,对地球磁尾中的全球亚暴动力学进行成像。该综合方法揭示了在2022年8月19日亚暴期间,电子与离子种群中薄电流 sheet、向地球方向运动以及V形各向同性边界的一致演化,相互验证了两种方法的有效性,并在宽广的能量范围内确认了关键的亚暴特征。
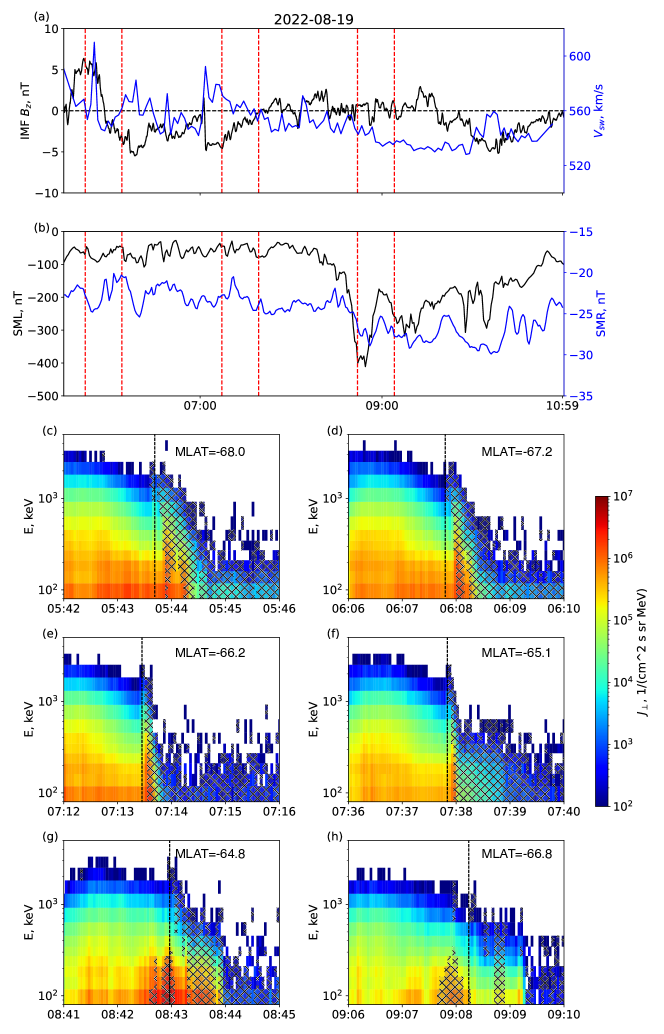
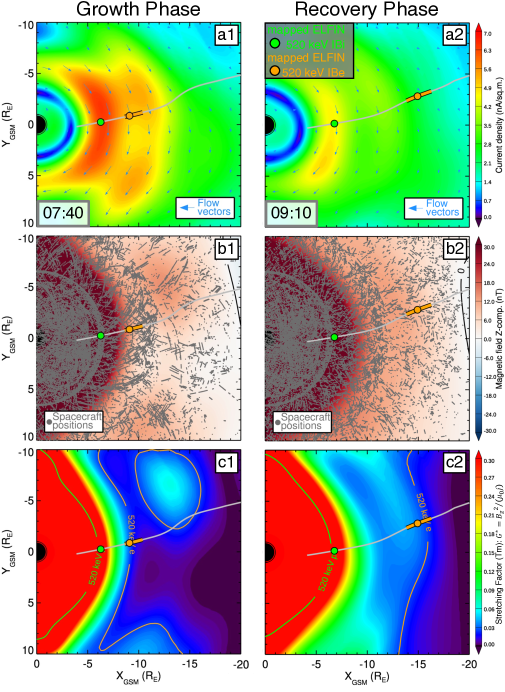
A global reconfiguration of the magnetotail characterizes substorms. Current sheet thinning, intensification, and magnetic field stretching are defining features of the substorm growth phase and their spatial distributions control the timing and location of substorm onset. Presently, sparse in-situ observations cannot resolve these distributions. A promising approach is to use new substorm magnetic field reconstruction methods based on data mining, termed SST19. Here we compare the SST19 reconstructions to low-altitude ELFIN measurements of energetic particle precipitations to probe the radial profile of the equatorial magnetic field curvature during a 19~August 2022 substorm. ELFIN and SST19 yield a consistent dynamical picture of the magnetotail during the growth phase and capture expected features such as the formation of a thin current sheet and its earthward motion. Furthermore, they resolve a V-like pattern of isotropic electron precipitation boundaries in the time-energy plane, consistent with earlier observations but now over a broad energy range.
研究动机与目标
- 利用稀疏的原位观测数据,解析亚暴期间磁尾磁场构型的全球空间演化。
- 将基于数据挖掘的磁场重构方法(SST19)与 ELFIN 任务获取的低空粒子沉降测量结果进行对比验证。
- 成像磁尾赤道磁场曲率的径向分布及其与粒子沉降边界的关系,涵盖亚暴的生长相与膨胀相。
- 探究由 ELFIN 衍生的各向同性边界与基于经验磁场重构推断的边界之间的一致性。
- 展示低近地轨道粒子探测器的遥感观测与历史磁力仪数据挖掘相结合,在亚暴动力学研究中的协同效应。
提出的方法
- 将 SST19 数据挖掘算法应用于超过二十年的磁力仪数据,以重建亚暴期间磁尾中的经验磁场构型。
- 利用 ELFIN 纳卫星测量低近地轨道(328 km 高度)处的高能电子与离子沉降,从而通过粒子各向同性边界推断磁场曲率与电流 sheet 位置。
- 通过磁力线追踪与 AACGM 坐标系,将 ELFIN 观测到的粒子沉降边界(IBe,i)映射至磁赤道。
- 利用拉伸因子 $ G^* = B_z^2 / ( u_0 j) $ 作为磁场曲率与电流 sheet 变薄的代理变量,比较 ELFIN 衍生的各向同性边界与 SST19 重构预测结果。
- 通过 $ K_{ ext{NN}} $ 方法选择相似亚暴阶段的磁力仪数据,构建合成探测器群,实现磁尾的时间分辨重构。
- 利用 GSM 坐标系下5分钟平均的磁场数据,将 SST19 重构结果与 MMS1 和 THEMIS 探测器的原位测量结果进行验证。
实验结果
研究问题
- RQ1在亚暴期间,ELFIN 粒子测量推导出的各向同性边界与基于数据挖掘的磁场重构(SST19)推断出的边界相比如何?
- RQ2亚暴的生长相与膨胀相中,磁尾电流 sheet 的径向与纬向演化特征是什么?
- RQ3SST19 重构的磁场构型是否能准确再现 ELFIN 所观测到的粒子沉降模式?
- RQ4是否能利用 ELFIN 与 SST19 在宽广能量范围内一致解析出各向同性电子与离子沉降边界的V形图案?
- RQ5各向同性边界向赤道方向运动的时间与空间一致性,是否与磁场拉伸与电流 sheet 变薄的演化一致?
主要发现
- ELFIN 与 SST19 重构结果在亚暴生长相期间均显示各向同性边界(IBe,i)向赤道方向一致运动,而在爆发后出现纬向发散。
- 在宽广能量范围(如 520 keV)内,各向同性电子与离子沉降边界的V形图案被成功解析,证实了早期观测结果,并实现了更高的空间与能量分辨率。
- SST19 重构成功捕捉到薄电流 sheet 的形成及其向地球方向的运动,$ G^* $ 图像中清晰显示出磁场拉伸与偶极化现象。
- SST19 在 ELFIN 高度(328 km)的磁场构型重构结果与 MMS1 和 THEMIS 探测器的原位测量结果高度一致,验证了 SST19 方法的可靠性。
- ELFIN 观测到的 520 keV 电子与离子各向同性边界在 SST19 重构中被一致映射至相同位置,证实了两种方法的可靠性。
- 由 ELFIN 数据推导出的磁场曲率径向分布与基于 $ G^* $ 的经验重构结果一致,表明粒子沉降能准确追踪局部磁场结构。
更好的研究,从现在开始
从阅读论文到最终审阅,大幅缩短您的研究时间。
无需绑定信用卡
本解读由 AI 生成,并经人工编辑审核。