
[论文解读] Pure Spectroscopic Constraints on UV Luminosity Functions and Cosmic Star Formation History From 25 Galaxies at $z_\mathrm{spec}=8.61-13.20$ Confirmed with JWST/NIRSpec
本文基于通过光谱确认的25个高红移星系,使用 JWST/NIRSpec,推导出 UV 光度函数与宇宙星形成率密度,提供纯光谱约束与下限,挑战某些快速演化模型。
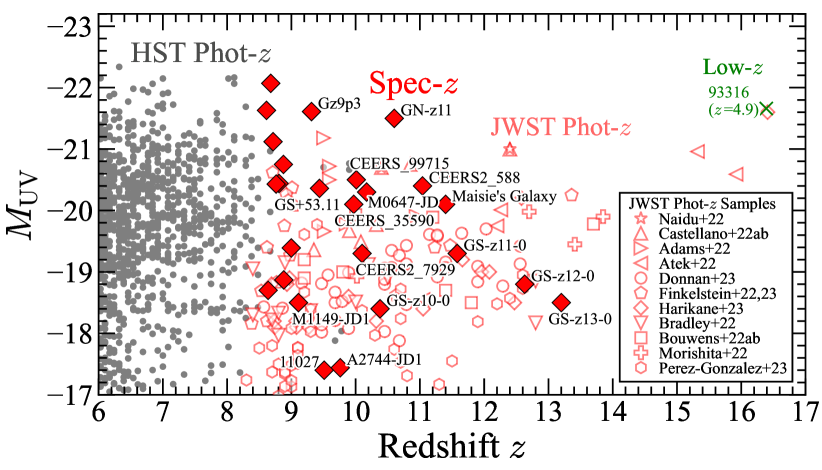
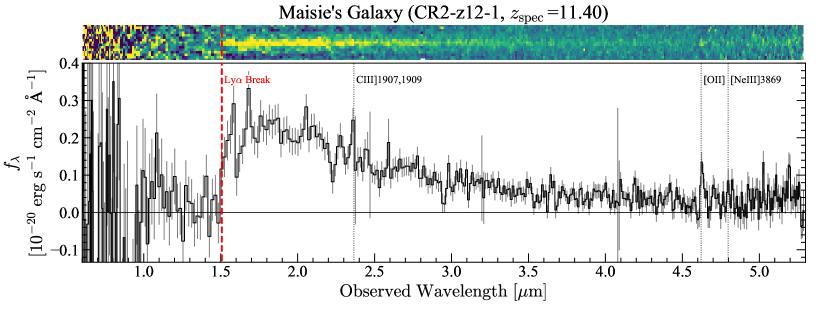
We present pure spectroscopic constraints on the UV luminosity functions and cosmic star formation rate (SFR) densities from 25 galaxies at $z_\mathrm{spec}=8.61-13.20$. By reducing the JWST/NIRSpec spectra taken in multiple programs of ERO, ERS, GO, and DDT with our analysis technique, we independently confirm 16 galaxies at $z_\mathrm{spec}=8.61-11.40$ including new redshift determinations, and a bright interloper at $z_\mathrm{spec}=4.91$ that was claimed as a photometric candidate at z~16. In conjunction with nine galaxies at redshifts up to $z_\mathrm{spec}=13.20$ in the literature, we make a sample of 25 spectroscopically-confirmed galaxies in total and carefully derive the best estimates and lower limits of the UV luminosity functions. These UV luminosity function constraints are consistent with the previous photometric estimates within the uncertainties and indicate mild redshift evolution towards z~12 showing tensions with some theoretical models of rapid evolution. With these spectroscopic constraints, we obtain firm lower limits of the cosmic SFR densities and spectroscopically confirm a high SFR density at z~12 beyond the constant star-formation efficiency models, which supports earlier claims from the photometric studies. While there are no spectroscopically-confirmed galaxies with very large stellar masses violating the $Λ$CDM model due to the removal of the bright interloper, we confirm star-forming galaxies at $z_\mathrm{spec}=11-13$ with stellar masses much higher than model predictions. Our results indicate possibilities of high star-formation efficiency (>5%), hidden AGN, top-heavy initial mass function (possibly with Pop-III), and large scatter/variance. Having these successful and unsuccessful spectroscopy results, we suggest observational strategies for efficiently removing low redshift interlopers for future JWST programs.
研究动机与目标
- 通过在 $z>8$ 的稳健光谱红移推动对早期星系形成的理解。
- 提供在 $z\,\sim\,9-12$ 的 UV 光度函数的清晰测量,以及对 SFR 密度的下限。
- 评估 UV LF 随红移的演化并检验与快速演化模型的对比。
- 探讨对高-$z$ 样本中的恒星形成效率、初始质量函数(IMF)、AGN 活动以及高红移样本中的低红移干扰体污染的含义。
提出的方法
- 汇编并重新分析来自 ERO、ERS、GO 和 DDT 项目的 JWST/NIRSpec 光谱,以获得可靠的红移。
- 并用文献中的光谱确认星系补充,以建立一个在 $z_{ m spec}=8.61-13.20$ 的 25 个对象的样本。
- 使用两种有效体积估计方法,在三个红移区间 ($z\sim9$, $z\sim10$, $z\sim12$) 计算 UV 光度函数,并在 $z\sim16$ 得到上限。
- 使用已发表的有效体积并保守地以 NIRSpec 视场来估计调查体积,以考虑选择效应。
- 从光谱样本推导宇宙 SFR 密度(包括下限),并与模型进行比较。
- 讨论在未来 JWST 调查中识别并去除低红移混入体的策略。
实验结果
研究问题
- RQ1基于经光谱确认的星系,在 $z\sim9$、$z\sim10$ 和 $z\sim12$ 的 UV 光度函数约束是什么?
- RQ2光谱约束是否指示向着 $z\sim12$ 的 UV LF 的温和红移演化?
- RQ3在 $z\sim9-12$ 的宇宙星形成率密度的结果下限是多少,与恒定星形成效率模型相比如何?
- RQ4数据是否揭示出高质量的恒星质量或其他信号(如高恒星形成效率、隐藏的 AGN、顶端重 IMF)来挑战标准的 ΛCDM 预测?
- RQ5哪些观测策略最能在针对 $z>10$ 的 JWST 调查中减轻低红移干扰体的影响?
主要发现
- 来自 25 个经光谱确认的星系的 UV 光度函数约束与先前的光度测量在不确定性范围内一致,并向着 $z\sim12$ 显示温和的演化。
- 对于宇宙星形成率密度有明确的下限,且数据支持在 $z\sim12$ 时的高 SFR 密度,超出恒定星形成效率模型。
- 在 $z\sim11-13$ 的一些经光谱确认星系的恒星质量高于模型预测,表明存在高星形成效率或其他过程。
- 移除在 $z_{spec}=4.91$ 的明亮干扰体后,与对亮光明亮 $z\sim>10$ 星系的 CDM 预测的张力有所缓解,尽管在恒星质量与 SFR 含义上仍有张力。
- 该研究指出高效星形成、隐藏 AGN 活动、顶端重 IMF 以及高-$z$ 星系性质的巨大散布等潜在作用,并讨论未来 JWST 项目中避免低红移干扰体的策略。
更好的研究,从现在开始
从阅读论文到最终审阅,大幅缩短您的研究时间。
无需绑定信用卡
本解读由 AI 生成,并经人工编辑审核。