
[论文解读] Ranking the Economic Importance of Countries and Industries
本文提出一种基于网络的框架,通过投入产出表建模相互依赖关系并模拟级联失效,以衡量国家和产业的经济重要性。研究发现,自2003年以来,中国的系统性经济影响力已超越美国,且对失效的容忍度持续上升,而美国的系统性韧性则随时间推移而下降。
In the current era of worldwide stock market interdependencies, the global financial village has become increasingly vulnerable to systemic collapse. The recent global financial crisis has highlighted the necessity of understanding and quantifying interdependencies among the world's economies, developing new effective approaches to risk evaluation, and providing mitigating solutions. We present a methodological framework for quantifying interdependencies in the global market and for evaluating risk levels in the world-wide financial network. The resulting information will enable policy and decision makers to better measure, understand, and maintain financial stability. We use the methodology to rank the economic importance of each industry and country according to the global damage that would result from their failure. Our quantitative results shed new light on China's increasing economic dominance over other economies, including that of the USA, to the global economy.
研究动机与目标
- 通过建模国家与产业之间的相互依赖关系,开发一种量化全球经济系统性风险的方法。
- 基于其失败所导致的全球损失,对国家和产业的经济重要性进行排名。
- 通过网络科学与投入产出分析,识别系统性脆弱性并提升金融稳定性。
- 评估经济权力结构的演变,特别是中国相对于美国的主导地位如何变化。
提出的方法
- 利用1995–2011年的投入产出表构建加权产出网络,以525个产业作为节点,产品价值作为边权重。
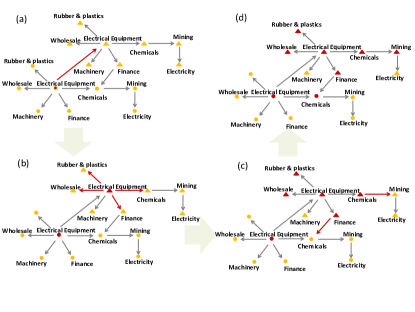
- 应用级联失效模型,模拟冲击在全球相互依赖的经济网络中的传播过程。
- 将容错阈值 $p_c$ 定义为网络崩溃前可失效的节点比例,用于衡量产业与国家的韧性。
- 采用假设提取法(HEM)评估产业影响,但将其扩展以通过级联效应评估系统性风险。
- 将各产业的 $p_c$ 值聚合,计算国家层面的容错度,反映其系统性重要性。
- 通过比较总产出与 $p_c$ 的趋势,区分经济规模与系统性影响力。
实验结果
研究问题
- RQ1哪些产业和国家对全球经济稳定具有最大的系统性重要性?
- RQ21995至2011年间,中国的系统性重要性相对于美国如何演变?
- RQ3一国的总产出在多大程度上与以 $p_c$ 衡量的系统性韧性相关?
- RQ4级联失效如何通过相互依赖的全球经济网络传播?
- RQ5世界投入产出网络中存在哪些结构性脆弱性,可能引发系统性崩溃?
主要发现
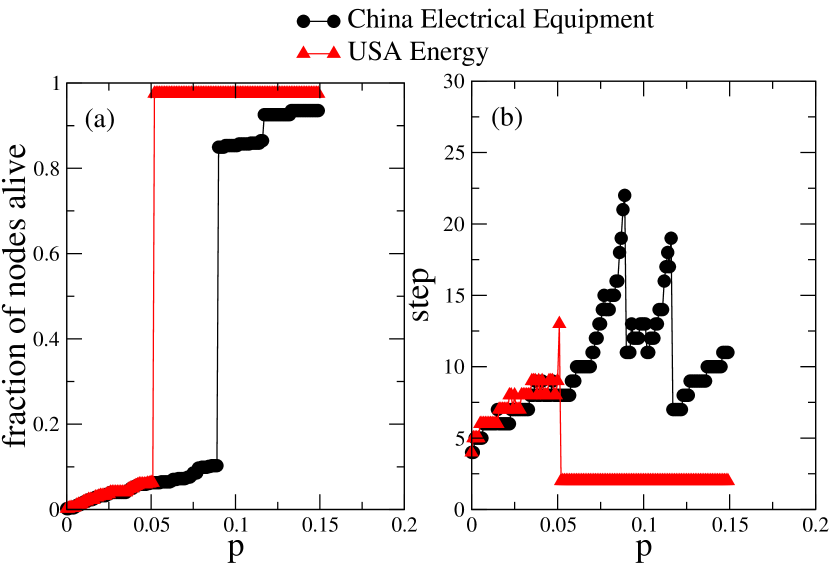
- 自2003年起,中国的系统性经济重要性(以 $p_c$ 衡量)超过美国,并持续增长至2011年。
- 尽管总产出持续增加,美国的 $p_c$ 容错度从2000年到2011年呈下降趋势,表明其系统性韧性减弱。
- 德国的 $p_c$ 随时间保持相对稳定,表明其系统性影响力持续但未增长。
- 中国前四大产业的平均 $p_c$ 从1995年到2011年显著上升,反映出其系统性重要性的提升。
- 尽管中国、美国和德国的总产出均随时间增长,但仅中国和德国在产出与 $p_c$ 上呈现同步增长,表明其系统性影响力更强。
- 总产出与 $p_c$ 的对比表明,系统性影响力无法仅通过经济规模推断,凸显了基于网络的风险度量的价值。
更好的研究,从现在开始
从阅读论文到最终审阅,大幅缩短您的研究时间。
无需绑定信用卡
本解读由 AI 生成,并经人工编辑审核。