
[论文解读] Revisiting Emission-Line Measurement Methods for Narrow-Line Active Galactic Nuclei
本研究重新审视窄线活动星系核(AGN)中发射线测量技术,重点关注仪器光谱分辨率对宽线宽度测量的影响。通过对比金巨望远镜(Gemini,185.6 km s⁻¹)和丽江望远镜(Lijiang Telescope,695.2 km s⁻¹)对Mrk 142的观测数据,表明在光谱拟合过程中固定窄线流量比可有效减少低分辨率数据中的人工展宽,使Hβ的FWHM测量结果与高分辨率测量结果的一致性提升约54%。
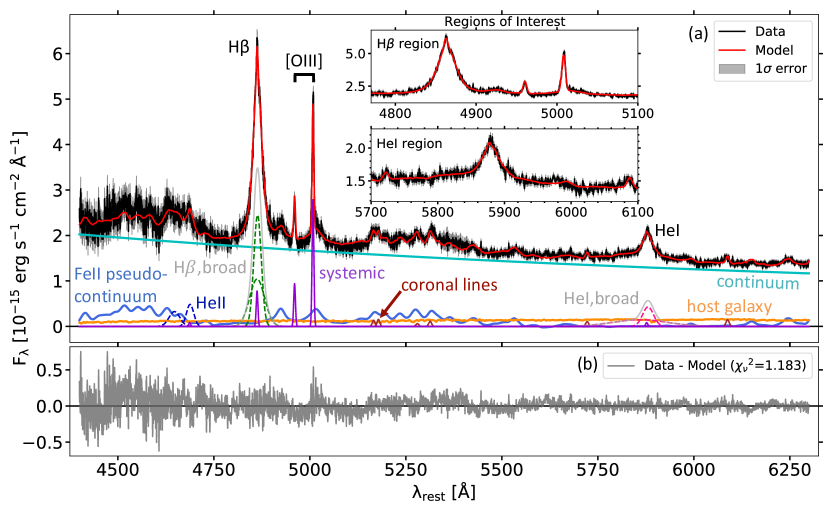
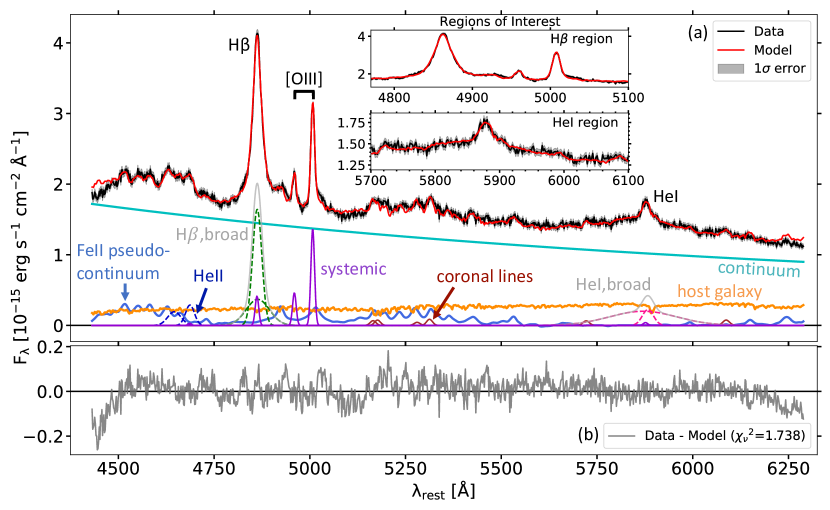
Measuring broad emission-line widths in active galactic nuclei (AGN) is not straightforward owing to the complex nature of flux variability in these systems. Line-width measurements become especially challenging when signal-to-noise is low, profiles are narrower, or spectral resolution is low. We conducted an extensive correlation analysis between emission-line measurements from the optical spectra of Markarian 142 (Mrk 142; a narrow-line Seyfert galaxy) taken with the Gemini North Telescope (Gemini) at a spectral resolution of 185.6+\-10.2 km/s and the Lijiang Telescope (LJT) at 695.2+\-3.9 km/s to investigate the disparities in the measured broad-line widths from both telescope data. Mrk~142 posed a challenge due to its narrow broad-line profiles, which were severely affected by instrumental broadening in the lower-resolution LJT spectra. We discovered that allowing the narrow-line flux of permitted lines having broad and narrow components to vary during spectral fitting caused a leak in the narrow-line flux to the broad component, resulting in broader broad-line widths in the LJT spectra. Fixing the narrow-line flux ratios constrained the flux leak and yielded the Hydrogen-beta broad-line widths from LJT spectra $\sim$54\% closer to the Gemini Hydrogen-beta widths than with flexible narrow-line ratios. The availability of spectra at different resolutions presented this unique opportunity to inspect how spectral resolution affected emission-line profiles in our data and adopt a unique method to accurately measure broad-line widths. Reconsidering line-measurement methods while studying diverse AGN populations is critical for the success of future reverberation-mapping studies. Based on the technique used in this work, we offer recommendations for measuring line widths in narrow-line AGN.
研究动机与目标
- 研究光谱分辨率差异对窄线AGN中发射线宽度测量的影响。
- 识别低分辨率光谱中因仪器展宽和流量泄漏导致的宽线宽度测量系统性偏差。
- 开发并验证一种校正方法,以提高高分辨率与低分辨率发射线测量之间的一致性。
- 为窄线AGN的测光延迟映射研究提供准确的线宽测量可行建议。
提出的方法
- 对窄线AGN Mrk 142的高分辨率(金巨望远镜,185.6 km s⁻¹)与低分辨率(丽江望远镜,695.2 km s⁻¹)光谱的发射线测量结果进行相关性分析。
- 通过可变窄线流量比的光谱拟合,识别低分辨率数据中窄线向宽线成分的流量泄漏。
- 通过基于高分辨率拟合结果固定Hβ与[O iii] λ5008窄线流量比,实施校正,以抑制低分辨率数据中的人工展宽。
- 比较校正前后LJT光谱中Hβ的FWHM测量值,量化其与高分辨率结果的一致性提升。
- 采用Sherpa及自定义的Python/astropy流程进行光谱降噪、拟合与误差分析。
- 评估校正前后FWHM测量的离散度与偏差,以评估方法的稳健性。
实验结果
研究问题
- RQ1仪器光谱分辨率在多大程度上影响窄线AGN中Hβ宽线FWHM的测量结果?
- RQ2在低分辨率光谱中,窄线向宽线成分的流量泄漏在多大程度上扭曲了宽线宽度的测量?
- RQ3固定Hβ与[O iii] λ5008窄线流量比是否能提高高分辨率与低分辨率光谱中Hβ FWHM测量结果的一致性?
- RQ4在低分辨率光谱中,未分辨的[O iii] λ5008线对Hβ FWHM测量有何影响?
- RQ5如何改进光谱拟合方法,以减少窄线AGN测光延迟映射研究中的系统性偏差?
主要发现
- 低分辨率LJT光谱中测得的Hβ宽线FWHM约为2220 km s⁻¹,显著宽于高分辨率金巨望远镜光谱中测得的约1930 km s⁻¹。
- 通过固定Hβ与[O iii] λ5008窄线流量比,LJT光谱中Hβ FWHM的平均值降低了约54%,使其与金巨望远镜测量结果更加一致。
- 固定窄线流量比后,LJT光谱中Hβ FWHM测量的离散度降低了2.6倍,与高分辨率金巨望远镜数据的离散度相当。
- 光谱拟合中窄线向宽线成分的流量泄漏——由低分辨率数据中未分辨的[O iii] λ5008线引起——是导致Hβ FWHM人工展宽的主要原因。
- 校正后残余的Hβ FWHM差异可能源于未分辨的Fe ii发射,表明需要更精确的Fe ii模板建模。
- 本研究证明,结合高分辨率与低分辨率光谱并施加适当的流量比约束,可实现对窄线AGN更准确、更一致的线宽测量。
更好的研究,从现在开始
从阅读论文到最终审阅,大幅缩短您的研究时间。
无需绑定信用卡
本解读由 AI 生成,并经人工编辑审核。