
[论文解读] TESS first look at evolved compact pulsators : Discovery and asteroseismic probing of the g-mode hot B subdwarf pulsator EC 21494-7018
本文报告了在TESS第1个观测段数据中发现并进行星震学分析的EC 21494-7018,这是一颗新发现的g模脉动热B型亚矮星。利用120秒采样率的光变曲线和先进的亚矮星恒星模型进行正向建模,研究确定了该星的质量(0.391 ± 0.009 M☉)、氢富集包层质量(0.0037 ± 0.0010 M☉)以及核心成分,揭示其为低质量前身星,可能避开了氦核心闪光,并首次直接估算出核心氧丰度(X(O)core = 0.16⁺⁰.¹³₋₀.₀₅)。
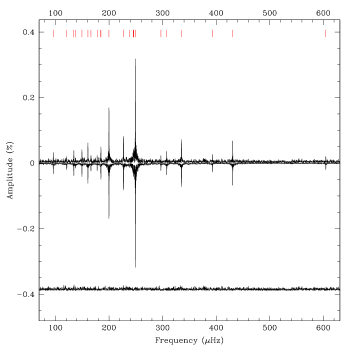
We present the discovery and asteroseismic analysis of a new g-mode hot B subdwarf (sdB) pulsator, EC 21494-7018 (TIC 278659026), monitored in TESS first sector using 120-second cadence. The light curve analysis reveals that EC 21494-7018 is a sdB pulsator counting up to 20 frequencies associated with independent g-modes. The seismic analysis singles out an optimal model solution in full agreement with independent measurements provided by spectroscopy (atmospheric parameters derived from model atmospheres) and astrometry (distance evaluated from Gaia DR2 trigonometric parallax). Several key parameters of the star are derived. Its mass (0.391 +/- 0.009 Msun) is significantly lower than the typical mass of sdB stars, and suggests that its progenitor has not undergone the He-core flash, and therefore could originate from a massive (>2 Msun) red giant, an alternative channel for the formation of hot B subdwarfs. Other derived parameters include the H-rich envelope mass (0.0037 +/- 0.0010 Msun), radius (0.1694 +/- 0.0081 Rsun), and luminosity (8.2+/-1.1 Lsun). The optimal model fit has a double-layered He+H composition profile, which we interpret as an incomplete but ongoing process of gravitational settling of helium at the bottom of a thick H-rich envelope. Moreover, the derived properties of the core indicate that EC 21494-7018 has burnt ~43% (in mass) of its central helium and possesses a relatively large mixed core (Mcore = 0.198 +/- 0.010 Msun), in line with trends already uncovered from other g-mode sdB pulsators analysed with asteroseismology. Finally, we obtain for the first time an estimate of the amount of oxygen (in mass; X(O)core = 0.16 -0.05 +0.13) produced at this stage of evolution by an helium-burning core. This result, along with the core-size estimate, is an interesting constraint that may help to narrow down the still uncertain C12(alpha,gamma)O16 nuclear reaction rate.
研究动机与目标
- 利用TESS光变曲线研究新发现的热B型亚矮星EC 21494-7018的脉动特性与内部结构。
- 通过星震学建模确定该星的基本参数——质量、半径、光度和包层质量。
- 基于其低质量和核心结构,评估该星的演化状态,特别是是否在演化过程中避开了氦核心闪光。
- 利用星震学建模约束核心成分,包括通过氦燃烧产生的氧。
- 通过独立的光谱学和天体测量学数据(Gaia DR2)验证星震模型。
提出的方法
- 使用标准去线性化技术分析TESS第1个观测段120秒采样率的光变曲线,提取脉动频率。
- 采用新一代详细的非对流、非旋转亚矮星恒星模型进行正向建模,以匹配观测到的频率。
- 同时拟合所有观测到的g模频率,以识别最佳匹配模型,从而确定恒星参数和内部结构。
- 利用最佳拟合模型推断氢富集包层质量、核心质量及核心成分,包括氧丰度。
- 通过光谱学大气参数和Gaia DR2三角视 parallax(距离)对星震解进行交叉验证。
- 在模型中采用双层He+H成分分布,以表示包层底部氦的不完全引力沉积分异。

实验结果
研究问题
- RQ1新发现的g模脉动星EC 21494-7018的内部结构和基本参数是什么?
- RQ2EC 21494-7018的低质量是否表明其在演化过程中避开了氦核心闪光?
- RQ3在氦燃烧核心中产生的氧丰度是多少?其如何约束¹²C(α,γ)¹⁶O反应速率?
- RQ4观测到的脉动谱与非对流亚矮星模型中的理论g模频率如何比较?
- RQ5观测到的成分分布与包层中持续进行的氦引力沉积分异在多大程度上一致?
主要发现
- EC 21494-7018是一颗g模脉动星,在TESS光变曲线中检测到20个独立的脉动频率。
- 该星质量为0.391 ± 0.009 M☉,显著低于典型亚矮星,表明其可能避开了氦核心闪光。
- 氢富集包层质量为0.0037 ± 0.0010 M☉,与厚但未完全混合的包层一致。
- 核心质量为0.198 ± 0.010 M☉,表明存在相对较大的混合核心,与其它g模亚矮星脉动星的趋势一致。
- 核心已燃烧约43%的中心氦,首次获得核心氧丰度的直接估计值,X(O)core = 0.16⁺⁰.¹³₋₀.₀₅。
- 最优模型表现出双层He+H成分分布,解释为氢富集包层底部氦的不完全引力沉积分异。
更好的研究,从现在开始
从阅读论文到最终审阅,大幅缩短您的研究时间。
无需绑定信用卡
本解读由 AI 生成,并经人工编辑审核。