[论文解读] The Atacama Cosmology Telescope: A search for late-time anisotropic screening of the Cosmic Microwave Background
本文提出一种新的前景鲁棒估计器,用于检测CMB的斑点筛选,并报告与unWISE星系的跨相关性大于7σ,指示在暗物质晕之外的星系周围存在扩展气体。
Since the formation of the first stars, most of the gas in the Universe has been ionized. Spatial variations in the density of this ionized gas generate cosmic microwave background anisotropies via Thomson scattering, a process known as the ``anisotropic screening'' effect. We propose and implement for the first time a new estimator to cross-correlate unWISE galaxies and anisotropic screening, as measured by the Atacama Cosmology Telescope and Planck satellite. We do not significantly detect the effect; the null hypothesis is consistent with the data at 1.7 $σ$ (resp. 0.016 $σ$) for the blue (resp. green) unWISE sample. We obtain an upper limit on the integrated optical depth within a 6 arcmin disk to be $\barτ< 0.033$ arcmin$^2$ at 95\% confidence for the blue sample and $\barτ< 0.057$ arcmin$^2$ for the green sample. Future measurements with Simons Observatory and CMB-S4 should detect this effect significantly. Complementary to the kinematic Sunyaev-Zel'dovich effect, this probe of the gas distribution around halos will inform models of feedback in galaxy formation and baryonic effects in galaxy lensing.
研究动机与目标
- 通过CMB的斑点筛选来激发对宇宙中气体分布的研究。
- 开发一种鲁棒估计器(sign estimator)以减轻斑点筛选测量中的前景偏差。
- 将CMB推导的斑点筛选与密集星系目录进行跨相关,以探测晕周围的气体。
- 将观测到的气体轮廓与模拟结果进行比较,以推断星系形成物理过程及气体分布。
- 表明斑点筛选可补充kSZ且不需要星系红移信息。
提出的方法
- 使用Planck-Planck NILC CMB图与ACT数据结合,形成分辨率高、尺度较小的CMB图。
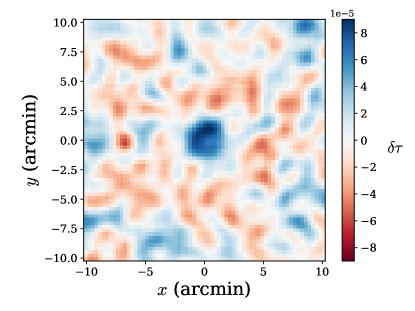
- 应用一种新颖的sign estimator,将对大型尺度CMB图进行符号变换后再乘以小尺度CMB涨落,以分离斑点筛选。
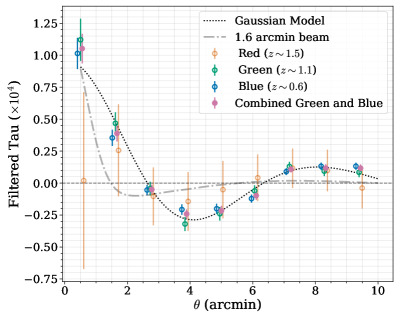
- 在unWISE星系位置对符号加权的CMB切片进行堆叠,并进行方位平均以获得一维光学深度轮廓。
- 通过不包含斑点信号的蒙特卡洛模拟计算协方差和显著性。
- 拟合一个双参数高斯模型到堆叠的光学深度轮廓,并用AIC和F检验评估模型比较。
- 将观测到的气体轮廓与Illustris、Illustris-TNG、SIMBA模拟以及来自kSZ分析的GNFW轮廓进行比较。
实验结果
研究问题
- RQ1在主导前景存在的情况下,是否可以使用基于符号的估计器鲁棒地检测斑点筛选?
- RQ2通过斑点筛选与CMB图的跨相关推断,unWISE星系周围电子的空间分布是什么?
- RQ3观测到的星系周围气体轮廓是遵循暗物质分布,还是因反馈过程而出现扩展气体?
- RQ4观测到的轮廓与最先进的水动力模拟以及GNFW拟合相比如何?
主要发现
- 蓝色与绿色unWISE样本结合显示光学深度轮廓的原假设被拒绝达到7.9σ。
- 一个对星系周围光学深度分布的高斯模型为相较于原假设(AIC)提供强有力的模型证据:蓝色、绿色、合并分别为-39、-43、-71;F检验的p值分别为0.003、0.013、0.0018。
- 测得的气体轮廓比从Illustris-TNG推断的暗物质轮廓更扩展,与SIMBA和Illustris类似但不完全相同。
- 数据更支持在星系周围存在扩展气体,而非点源分布。
- sign-estimator方法对前景偏差具有鲁棒性,只需要2D星系位置,不需要红shift或速度信息。
- 与模拟的比较表明,unWISE星系周围的气体并不追随暗物质分布,并可提供有关反馈过程的信息。
更好的研究,从现在开始
从论文设计到论文写作,大幅缩短您的研究时间。
无需绑定信用卡
本解读由 AI 生成,并经人工编辑审核。