
[论文解读] The reionising bubble size distribution around galaxies
本研究利用大规模(1.6 Gpc³)宇宙学模拟,模拟了宇宙再电离期间高红移星系和高密度区域周围的电离泡大小分布。结果表明,在 z ≈ 7–8 时,紫外明亮星系和强高密度区域极有可能位于大电离泡(>1 恒定距离 Mpc)中,概率较高;但在 z ≈ 8.7 时概率显著降低,提示 z > 8 的 Lyα 检测可能需要更低的 IGM 中性分数、更明亮的源,或增强的本征 Lyα 辐射。
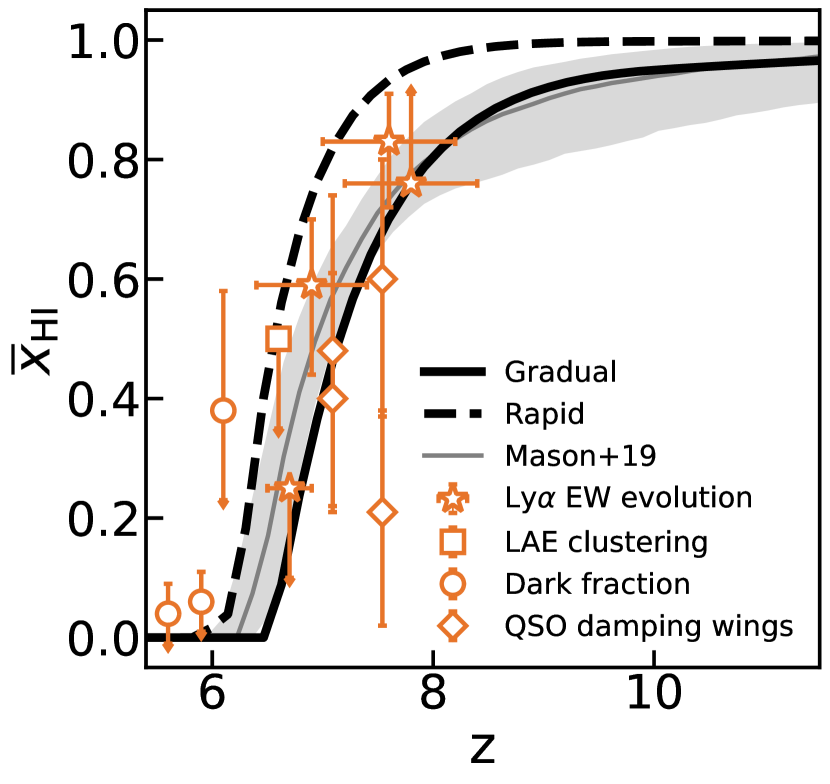
Constraining when and how reionisation began is pivotal for understanding when the first galaxies formed. Lyman-alpha (Ly$α$) emission from galaxies is currently our most promising probe of these early stages. At z>7 the majority of galaxies detected with Ly$α$ are in candidate overdensities. Here we quantify the probability of these galaxies residing in large ionised bubbles. We create (1.6 Gpc)$^3$ reionising intergalactic medium (IGM) simulations, providing sufficient volume to robustly measure bubble size distributions around UV-bright galaxies and rare overdensities. We find $M_{ m UV} \lesssim -16$ galaxies and overdensities are $\gtrsim$10-1000x more likely to trace ionised bubbles compared to randomly selected positions. The brightest galaxies and strongest overdensities have bubble size distributions with highest characteristic size and least scatter. We compare two models: gradual reionisation driven by numerous UV-faint galaxies versus more rapid reionisation by rarer brighter galaxies, producing larger bubbles at fixed neutral fraction. We demonstrate that recently observed z~7 overdensities are highly likely to trace large ionised bubbles, corroborated by their high Ly$α$ detection rates. However, the z~8.7 association of Ly$α$ emitters in EGS and GN-z11, with Ly$α$ at z=10.6, are unlikely to trace large bubbles in our fiducial model -- 11% and 7% probability of >1 proper Mpc bubbles, respectively. Ly$α$ detections at such high redshifts could be explained by: a less neutral IGM than previously expected; larger ionised regions at fixed neutral fraction; or if intrinsic Ly$α$ flux is unusually strong in these galaxies. We discuss how to test these scenarios with JWST and the prospects for using upcoming wide-area surveys to distinguish between reionisation models.
研究动机与目标
- 量化高红移星系和高密度区域在宇宙再电离期间位于大电离泡中的可能性。
- 通过泡大小分布区分由大量暗淡星系驱动的再电离模型与由稀有明亮星系驱动的模型。
- 根据电离泡大小和 IGM 中性分数,解释近期高红移 Lyα 检测结果(如 z ≈ 7–8 和 z ≈ 10.6)。
- 预测未来 JWST 和 Euclid 巡天中电离泡的可探测性,评估其约束再电离模型的能力。
提出的方法
- 执行(1.6 Gpc)³ 的宇宙学模拟,研究再电离期间的星际介质(IGM),包含辐射转移和源反馈。
- 追踪不同红移和 IGM 中性分数下,紫外明亮星系和星系高密度区域周围的电离泡大小。
- 比较两种再电离模型:由暗淡星系缓慢再电离(低逃逸分数)和由明亮星系快速再电离(高逃逸分数)。
- 利用泡大小分布,计算在固定中性分数和源光度下,宿主泡 >1 恒定距离 Mpc 的概率。
- 基于基准模型预测,预测未来巡天(JWST COSMOS-Web、Euclid Deep、Roman Wide)中的泡数密度。
- 分析宇宙方差和巡天体积对探测大电离区域的影响。

实验结果
研究问题
- RQ1在 z ≈ 7–8 时,紫外明亮星系和高密度区域位于大电离泡(>1 恒定距离 Mpc)中的概率是多少?
- RQ2由暗淡星系驱动的再电离模型与由明亮星系驱动的模型在泡大小分布上如何不同?
- RQ3为何在基准模型下,z ≈ 8.7 的 Lyα 检测(如 EGS 和 GN-z11)不太可能位于大电离泡中?
- RQ4哪些条件(如更低的中性分数、更高的本征 Lyα 辐射或更明亮的源)可解释高红移 Lyα 检测?
- RQ5像 Euclid 和 Roman 这类宽视场巡天能否探测电离泡的大小分布并约束再电离模型?
主要发现
- 紫外光度 M_UV < -16 的星系和高密度区域,其位于大电离泡中的概率比随机位置高出 10–1000 倍。
- 随着紫外光度和高密度程度增加,特征泡大小增大,分布离散度减小,表明对大区域的更强择优倾向。
- 在 z ≈ 7–8 时,高密度区域有 >40–93% 的概率宿主泡 >1 恒定距离 Mpc,与高 Lyα 检测率一致。
- 在 z ≈ 8.7 时,EGS 和 GN-z11 的大泡(>1 恒定距离 Mpc)概率分别仅为 ~11% 和 ~7%,表明这些检测很可能需要非标准条件。
- 高红移 Lyα 检测可能需要更低的 IGM 中性分数(x_HI < 0.8)、在固定 x_HI 下更大的泡,或异常强烈的本征 Lyα 辐射。
- 除非 x_HI < 0.9,否则 JWST COSMOS-Web 巡天不太可能探测到 >10 cMpc 的泡;但 Euclid 和 Roman 巡天将具备足够体积,可低宇宙方差地测量泡大小分布。
更好的研究,从现在开始
从阅读论文到最终审阅,大幅缩短您的研究时间。
无需绑定信用卡
本解读由 AI 生成,并经人工编辑审核。